This is a difficult question to answer. As Matt Graham at the Bipartisan Policy Center has pointed out, the rate of internal removals as a percentage of all Immigration and Customs Enforcement (ICE) removals has declined during the Obama Presidency. But this, in and of itself, doesn’t tell us much about the long run trends of internal enforcement. We need data from the past that we can compare President Obama’s immigration enforcement record to. We only have the rate of internal deportations for the last year of the Bush Administration. Cato has filed a FOIA to find out if the government kept statistics on internal versus border removals prior to 2008 but I’ve heard the data wasn’t kept.
Let’s assume that 63.6 percent of all ICE removals were internal from 2001 to 2007. I chose 63.6 percent because that was ICE’s internal removal rates in the year 2008 – the first year when that statistic is available. That means that the number of internal removals under the Bush administration was about 1.25 million. From 2009–2013, the Obama administration’s has removed just over 1 million from the interior of the United States. Of course, Bush had three more years to deport unauthorized immigrants. 660,000 people were removed from the interior of the United States during the first five years of the Bush administration.
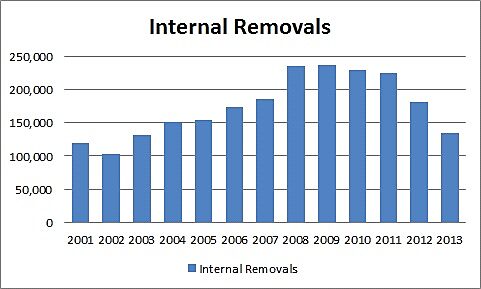
Source: Department of Homeland Security, BPC, Author’s Calculations.
President Bush removed an average of about 250,000 unauthorized immigrants a year, an average of 160,000 of them annually were interior removals. President Obama has removed an average of 390,000 unauthorized immigrants a year, an average of 200,000 of them annually were interior removals.
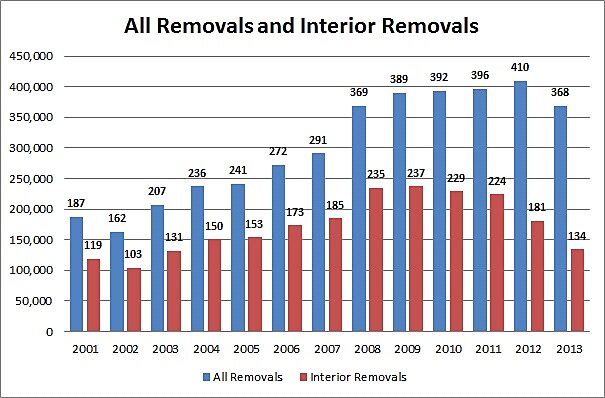
Source: Department of Homeland Security, BPS, Author’s Calculations.
As I’ve written before, the best way to measure the intensity of immigration enforcement is to look at the percentage of the unauthorized immigrant population deported in each year.
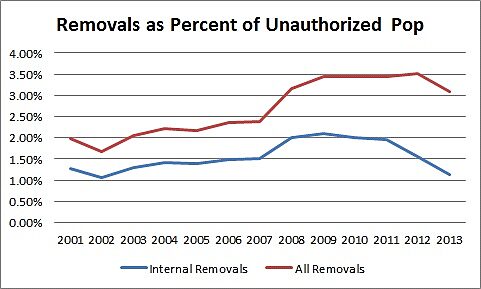
Source: Department of Homeland Security, BPC, Pew, Author’s Calculations.
I focus on the internal removal figures as a percentage of the estimated unauthorized immigrant population and assume that the internal removal rate of 63.6 percent prevailed throughout the Bush administration. If that interior enforcement rate was steady, then the Bush administration deported an average of 1.43 percent of the interior unauthorized immigrant population every year of his presidency. President Obama’s administration has deported an average of 1.75 percent of the interior unauthorized immigrant population every year of his presidency. Even when focusing on interior removals, President Obama is still out-deporting President Bush — so far.
The Obama interior removal statistics certainly show a downward trend – especially in 2012 and 2013. However, the Obama administration has not gutted or radically reduced internal immigration enforcement no matter how you dice the numbers.
