Global Science Report is a weekly feature from the Center for the Study of Science, where we highlight one or two important new items in the scientific literature or the popular media. For broader and more technical perspectives, consult our monthly “Current Wisdom.”
You can get anything you want
At Alice’s Restaurant
‑Arlo Guthrie, 1967
Late last week, the U.S. Global Climate Change Research Program (USGCRP) released a draft version of its latest assessment report on the impacts of climate change in the United States. Updated reports are required by Congressional decree every 4 years or so. The 2013 report, as it now stands, tips the scales at over 1,000 pages, consequently, we haven’t made our way through it yet, but if the Executive Summary is any indication, this report seems even worse than the one the USGCRP released in 2009.
This is yet another example of our imperial government’s predilection towards “show science” in order to justify taking people’s stuff. By analogy, think of the “show trials” in some of history’s more freedom-loving regimes.
As of this writing, it’s not clear if they intend to produce another “summary” document, such as the 200-pager they put out in 2009. That one was so bad as to require us to produce an Addendum that represents what the USGCRP report coudda, shoudda, woudda looked like had the author team made a more complete and fair assessment of the scientific literature.
Admittedly, our Addendum report, which was finalized and released last fall, did include citations from the scientific literature that were published subsequent to the publication of the 2009 USGCRP report, which obviously the USGCRP report authors couldn’t have known about. But, as our Addendum demonstrates, when these new research results are included, the potential impacts of climate change in the U.S. are substantially tempered. This leads us to think that the 2013 version from the USGCRP—which seems to hype the impacts of anthropogenic greenhouse gas emissions even more so than the 2009 report did—didn’t do a grand job in synthesizing the literature.
Nor does it appear they did a good job with the statistics of climate and climate change in the U.S.
Here is but one example of your tax dollars at work. From the USGCRP draft report:
U.S. average temperature has increased by about 1.5°F since 1895, with more than 80% of this increase occurring since 1980.
This sentence is consistent with the lurid story being told by the authors, but is by no means a robust statistical assessment of the U.S. temperature record.
The latest version of the official U.S. temperature record (at least for today—the historical data are subject to change daily in the new “data homogenization” (!) routines) is shown in Figure 1. And indeed, a linear fit through the data indicates that the overall trend is 0.13°F per decade, which, over the 118 years’ worth of data (1895 through 2012) produces about 1.5°F of total temperature rise.
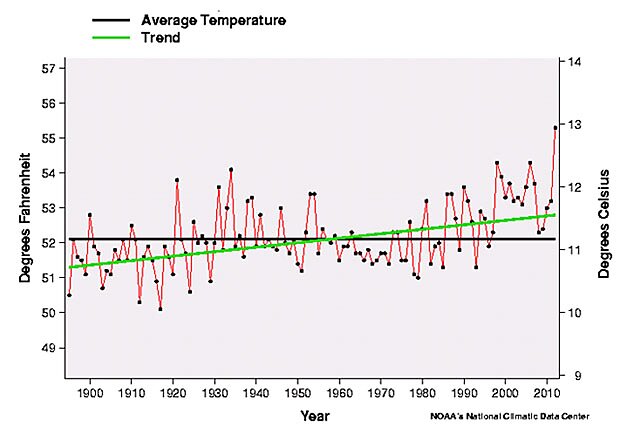
Figure 1. U.S. annual average temperatures (°F), 1895–2012, as continuously compiled and updated by the National Climatic Data Center, and fit with a linear trend over the entire period of record (Source: National Climatic Data Center).
But does attributing “more than 80% of this increase” since 1980 make any kind of sense at all? And how would you even go about doing that?
Probably the best way to do this would be to simply take the overall rate of temperature rise (0.13°F/decade) and multiply it by the number of decades between 1980 and now (3.3) and then divide by the overall temperature change (1.5°F). When you do this, you get 29% of the overall rise has occurred since 1980. Since 29% is nowhere close to being “more than 80%,” clearly this is not how the USGCRP authors made their determination.
Another way to do it would be to find the maximum amount of temperature rise that occurred at any time before 1980 and then determine how much more the temperature since 1980 has risen above that amount. For example, from 1895 through 1940, the U.S. annual average temperature increased at a rate of 0.27°F per decade for 4.5 decades for a total rise of 1.2°F. That only leaves 0.3°F of the total overall rise of 1.5°F left over. So the maximum proportion of temperature rise that could have occurred since 1980 is 20%. Again, 20% is nowhere close to being more than 80%, so clearly this is not how they did it.
Another way would be to calculate the linear temperature rise between 1895 and 1979, subtract that from the 1.5°F total rise and assign whatever is left over to the period 1980 to 2012. When you do this, you get that 77% of the rise occurred since 1980. At least this is starting to get close to the USGCRP number.
Or, you could calculate the linear rise from 1980 to 2012 and compare this to the total rise. When you do this, you find that the rise from 1980 to 2012 was 1.58°F. Or, 105% of the total rise! 105% is definitely more than 80%, so maybe that is what they did.
Or perhaps the USGCRP authors did something completely different. Who knows?
Now, before we go any further, let’s get something straight—none of these methods for determining the proportionate amount of warming is statistically sound because the nature of temperature rise in the U.S. during the last 118 years is not strictly linear. Instead, there are multi-decadal periods of rising and falling temperatures (see Figure 1). So attempting to describe the proportional change over some period of time is cherry-picking by design. As we show in the examples above, you have a wide variety of answers at your disposal depending on your analysis method. The USGCRP authors clearly wanted to choose a method that produced the appearance of a lot of rise since 1980 (and thereby completely disregarding a more rapid warming from 1910–1940).
Why? Heck, ask the guy responsible for the report (jmelillo@mbl.edu). We surely don’t know but our guess is that they wanted to make the impact of anthropogenic greenhouse gas emissions seem as large as they possibly could, which is certainly consistent with keeping the 60 authors flying first class.
And this, in a nutshell, is the feeling we are getting about the entire report.
That’s just not from our own spot checks, but from other as well (for starters, see comments from Roger Pielke Jr. and Judith Curry).
Looks like our our Center for the Study of (Show) Science is going to have a good time at Alice’s Restaurant.
