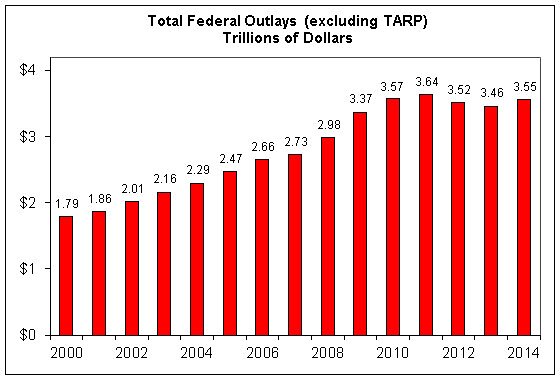
The CBO released its new budget outlook today. The chart below shows total federal spending since 2000. Spending was way up under Bush and the first two years of Obama, and roughly flat since then.
Note for wonks: I’ve taken TARP out of the data to remove a distortion in the historical trend. CBO included $151 billion in TARP outlays for 2009, and then reversed out most of it from reported outlays in later years. Without this adjustment, CBO shows a $151 billion spending spike in 2009 that did not actually occur.