Many Americans feel that the United States government is not in control of the border and that the lack of control is a deliberate government policy. Nothing could be further from the truth. The government has greatly expanded the scale and scope of immigration enforcement on the southern border in recent decades.
The government built fencing on the southwest border and increased the mileage from zero in 1990 to 653 today (Figure 1). Some of that fencing is porous and much of it is made to deter vehicles, but it is located in some of the previously most heavily trafficked areas. The effect was that unlawful immigrants were forced to cross in new, more dangerous areas. President-elect Donald Trump said he wants a 1,000-mile wall at the border, which means he’s already most of the way there.
Figure 1
Border Fencing
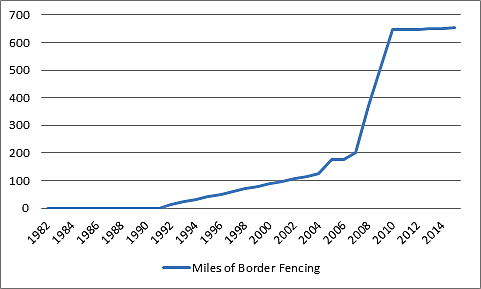
Source: Congressional Research Service.
Similarly, the number of border patrol agents has grown more than 8‑fold since 1982 compared to a 4 percent overall decrease in the number of non-military federal employees in the legislative, judicial, and executive branches (this does not include federal contractors). This vast expansion is underreported but it hasn’t dimmed the clamor for more resources and agents (Figure 2).
Figure 2
Border Patrol and Non-Military Federal Employees Indexed to 1982
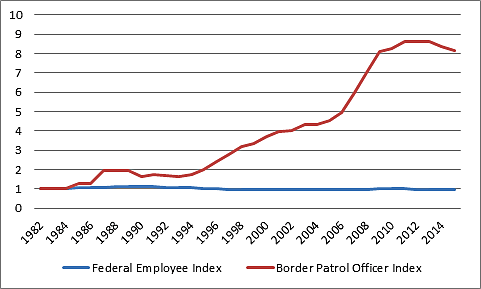
Sources: Office of Personnel Management and Customs and Border Protection.
Estimates vary, but the gross number of illegal immigrant entries has also declined. That decrease is explained in part by increased enforcement but also by poor job growth in the United States and more guest worker visas. One estimate of the gross illegal entries shows a sharper decline (Figure 3) than the other (Figure 4) but they both show a steep decline in recent years.
Figure 3
First Estimate of Gross Inflow of Illegal Immigrants
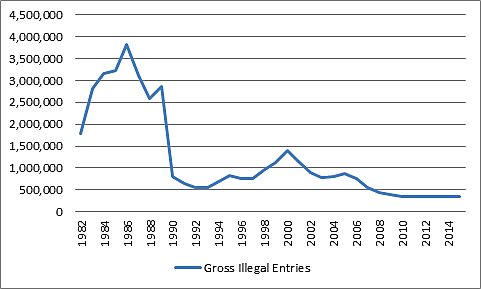
Sources: Massey and Singer, Warren and Kerwin, and Pew Hispanic Research Center.
Figure 4
Second Estimate of Gross Inflow of Illegal Immigrants
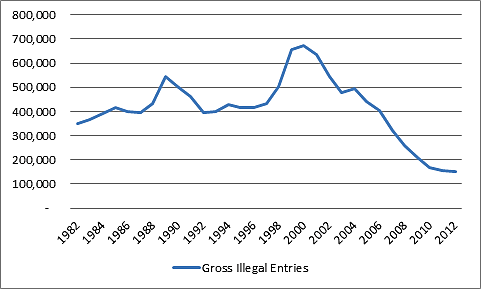
Source: Warren and Kerwin.
From 1982 to the end of 2015, 98.6 percent of all apprehended unlawful immigrants have been returned or removed (R&Rs) to their home countries (Figure 5). The Obama administration has not relaxed immigration enforcement along the border (Figure 6). Some years have more R&Rs than apprehensions because the unlawful immigrants are apprehended in the earlier year and then deported in the following year (Figure 6).
Figure 5
Returns & Removals and Apprehensions
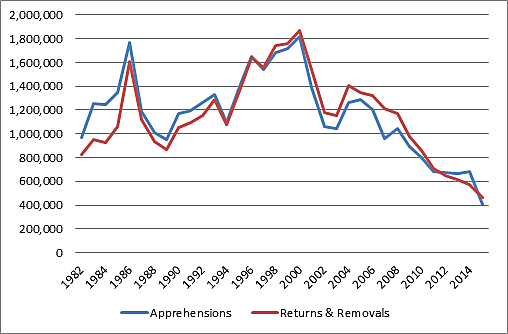
Sources: Yearbook of Immigration Statistics and Immigration and Customs Enforcement.
Figure 6
Ratio of Returns & Removals to Apprehensions
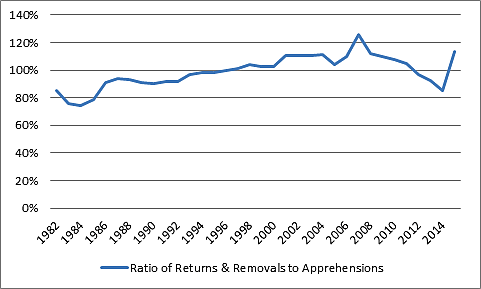
Source: Yearbook of Immigration Statistics and Immigration and Customs Enforcement.
The Obama administration did massively ramp up interior enforcement from 2009 to 2011. His administration increased the percentage of the entire unlawful immigrant population deported every year as well as and the total number of people deported from the interior of the United States (Figure 7).
Figure 7
Interior Removals
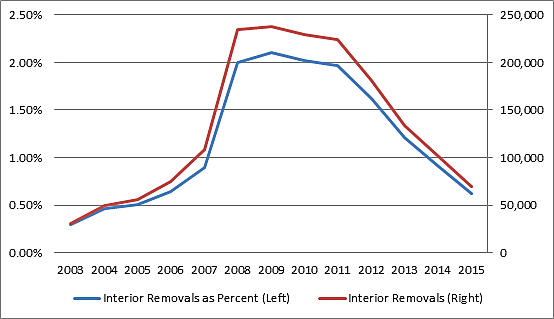
Source: Migration Policy Institute and Immigration and Customs Enforcement.
President Obama’s administration did substantially shift how unlawful immigrants are apprehended (Figure 8). Customs and Border Protection (CBP) apprehended over 90 percent of all unlawful immigrants prior to 2008 but in that year non-CBP agencies like Immigration and Customs Enforcement (ICE) started to play a much larger role. About 39 percent of the shift from 2007 to 2008 can be accounted for by a decrease in unlawful immigrants apprehended at the border who were deterred by the Great Recession, while about 61 percent can be accounted for by an increase in non-CBP apprehensions. That trend continued until 2011 when about equal numbers of unlawful immigrants were apprehended by CBP and non-CBP agencies. Since 2011, CBP’s proportion of apprehended unlawful immigrants has climbed to just below what it was 2007 even though the number crossing the border has fallen—a trend maintained by the 79 percent decline in non-CBP apprehensions from 2011 to 2015.
Figure 8
How Unlawful Immigrants are Apprehended
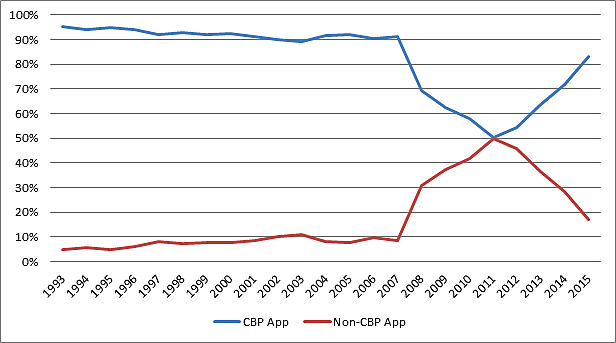
Sources: Yearbook of Immigration Statistics, Customs and Border Protection, and Author’s Calculations.
The size of the illegal immigrant population has fallen during the entire Obama administration due to the lackluster economy, increased immigration enforcement, and more guest workers (Figure 9). President Obama managed to achieve what the last three presidents before him failed to do: leave the White House with fewer illegal immigrants in the country than when he entered without a formal amnesty. Although his reputation as the Deporter-in-Chief has dimmed in recent years due to DACA and DAPA, his administration likely will have removed as many illegal immigrants from the United States during his two terms as were removed from 1978 to 2008.
Figure 9
Unlawful Immigrant Population
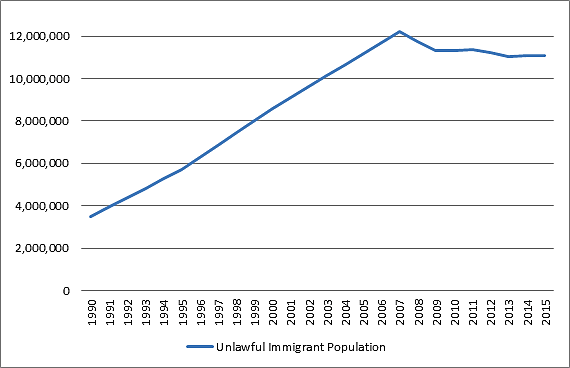
Source: Pew Hispanic Research Center.
The decline in unlawful immigrant entries means many border patrol agents are twiddling their thumbs. As recently as 2007, each border patrol agent apprehended an average of 59 unlawful immigrants (Figure 10). By 2015, that number had fallen to a mere 17. The decline in unlawful immigrants entries and the increase in border patrol has left many of them with little to do. Their numbers should be cut or, at an absolute minimum, not expanded any further.
Figure 10
Border Apprehensions per Border Patrol Agent
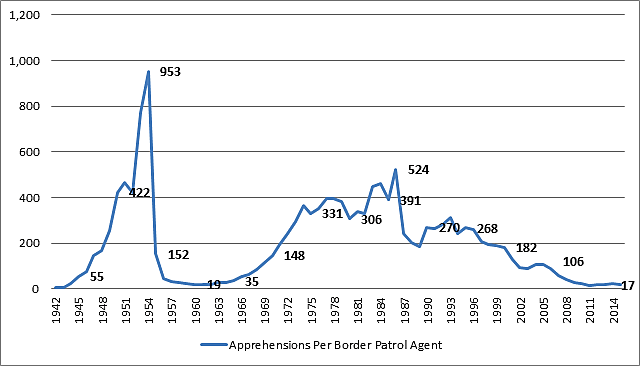
Sources: Immigration and Nationalization Service, Customs and Border Protection, and Yearbook of Immigration Statistics.
A major concern over unlawful immigration is how it affects crime rates. If the border was truly a zone of lawless chaos then there should be increases in violent and property crime. Although not all counties or cities bordering Mexico report violent and property crime rates per 100,000, those that do show a steady decline in crime rates over time (Figure 11). There are certainly illegal immigrants who commit violent and property crimes but it hasn’t caused a crime wave on the U.S. border.
Figure 11
Crime Rates in Border Counties and Police Departments
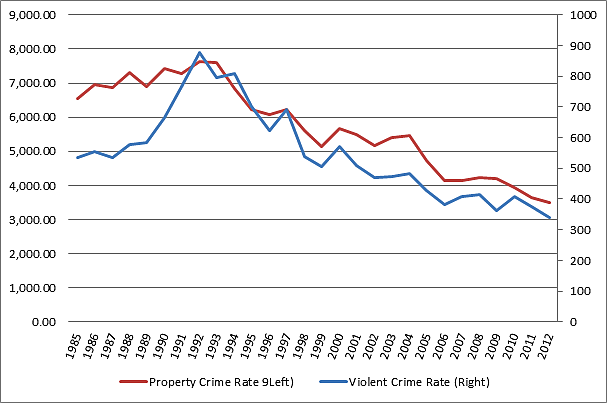
Source: FBI Uniform Crime Reporting Statistics.
President-elect Donald Trump has called for a large increase in border enforcement including the expansion of a wall. The decline in the flow of illegal immigration, relative peace at the border, 653 miles of border wall, and a huge increase in the size of the enforcement bureaucracy are evidence that the government does not need to expand immigration enforcement.
