A Wall Street Journal editorial “The Fed’s Big Inflation Miss” hinges on a graph showing the year-to-year percentage increase in the consumer price index (CPI) “increased at an annual 5.4% rate in June, after rising 5% at an annual rate in May. The Fed is way behind the price curve. Price increases would have to decline precipitously in the next six months to get close to the Fed’s median June forecast of 3.4% for 2021.” By the measure cited, however, the average of the past six monthly year-to-year changes was 3.35%.
One source of this and other misunderstandings comes from the habitual media use of year-to-year percentage changes to approximate what happened to prices month by month.
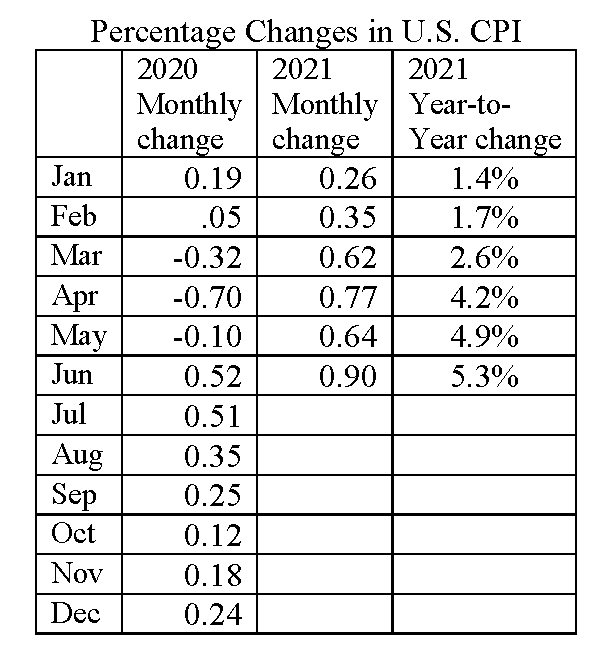
Some prominent economists recently warned that the year-to-year increase in the consumer price index (CPI) could reach 6–7% by December without a major tightening of monetary and/or fiscal policy. Since that year-to-year CPI change was 5.3% in June, projecting a slightly higher number by December (6–7%) may seem to imply that monthly inflation will speed up in the second half of the year. On the contrary, if average CPI increases remained the same from July to December as they were January to June, the year-to-year percentage increases would nonetheless be reported as rising every month simply because of cumulative compounding. Anyone projecting a year-to year CPI increase of 6–7% is not, in fact, expecting monthly inflation to be nearly as high as it was in the past four months (0.73), or to even match the lower monthly average (0.592) of the past six months.
Compound interest means an assumed 0.592 monthly increase would be added to a larger and larger index number each month, so the consumer price index would rise from nearly 271.0 in June to over 280.7 by December. The result is that even though the rate of monthly inflation is assumed unchanged from the January to June norm, the year-to-year increase would be reported as rising from 5.4% in July, to 5.7% in August, 6.0% in September, 6.5% in October, 7.0% in November, and 7.3% in December. If that happened, we would undoubtedly be reading scary headlines about rising inflation. Yet the monthly rate of inflation, in this hypothetical scenario, would be substantially slower than it was during the past four months (0.73).
A monthly rise of only 0.5 would up to a compound rate of 6%, while a monthly rise of 0.583 would add up to 7%. Since actual increases averaged 0.592 from January to June, leaving inflation unchanged would gradually make December’s CPI 7.3% higher than a year before. Looked at as a year-to-year compound rate, getting to an “annual rate” of 3.4% by year end would indeed require monthly “price increases to decline precipitously in the next six months,” as the editorial said. But that is one of several compelling reasons not to use compounded year-to-year percentage changes to track what is happening in real time, month by month.
As the Table shows, the average monthly increase in the Consumer Price Index (CPI) from January to June was low in 2020 (0.179 per month) largely because many prices fell from March to May as COVID-19 fears and lockdowns collapsed the economy. Comparing this year’s monthly price increases from March to May was quite misleading (the notorious “base effect”), because the percentage increases were calculated from deeply deflated levels in 2020. Even so, monthly increases have been undeniably steep over the past four months, averaging 0.73 per month.
Year-to-year percentage changes in the CPI purport to show what happened to inflation each month, but they can mislead about both recent news and trends because of base effects and compounding. A more timely and less bewildering alternative is to simply monitor monthly changes over several months. A four to six-month average would be better than twelve. And any temptation to multiply monthly changes by twelve to concoct an annual rate must be resisted – since doing that could make it look as though inflation in June and July of 2020 was 6.2%.
