
In the first, 1922 edition of Money, his own now-classic primer on monetary economics, the great Dennis Robertson included a chapter he called “Money in the Great Muddle,” about the blow World War I dealt to England’s once (relatively) rock-solid monetary system, and to other monetary arrangements worldwide. To Money’s fourth (1947) edition, Robertson added a new chapter concerning the Great Depression and its monetary aftermath, calling it “Money in the Second Great Muddle.”
So it is with a bow to Sir Dennis — and a rueful awareness of the likelihood of still other muddles to come — that I have chosen the title for my own primer’s assessment of monetary policy surrounding the upheaval known as the Great Recession.
A primer on American monetary policy is, needless to say, no place for a detailed account of the the causes of that calamity. It ought, nonetheless, to say something about the part that monetary policy, and the Fed’s monetary policy decisions in particular, played in it.
Some Preliminaries
To get a handle on the Fed’s contribution to the crisis, one must be willing to do what all too many commentators on monetary policy seem incapable of doing, to wit: set aside the temptation to treat central banks as being congenitally prone to create too much money, or predisposed to create too little. The sad truth is that central banks are perfectly capable of creating too much money on some occasions, and too little on others, and that it isn’t at all unusual for them to sway intemperately from one off-kilter stance to the other, with scarcely a pause in between.
But that’s not all. One must also be willing to set aside the more dispassionate belief that, so long as the rate of consumer price inflation is stable and modest, monetary policy is neither excessively easy nor excessively tight. Popular as that belief is, even among many monetary economists and policymakers, it is also, I’m sorry to say, facile. Among other things, it confuses the behavior of consumer or final-output prices, which is what the more popular price-indexes measure, with that of the “general” price level, and therefore neglects the possibility that changes in the rate of CPI or PCE inflation may actually signify, not excessive or deficient money growth, but changes in unit production costs, that is, in the price of output relative to that of inputs, including labor.
When the PCE index goes up, for example, that could mean that excessive money creation has caused the demand for output to increase relative to a stable supply. But it could also mean that unit output costs have risen. The same goes for “core” PCE index, which excludes food and energy prices. A falling PCE index could, on the other hand, mean either that the demand for final goods has shrunk relative to an unchanging supply, or that final goods, having become less expensive to produce, are also becoming more abundant, so that the same amount of spending buys more of them.
Suppose, to offer a concrete case, that in a heavily agricultural economy a series of harvest failures leads to higher prices. Only a blockhead would insist that the monetary authorities there must have created too much money, and that it would help matters for them to draw in the money-creation reins enough to get prices back down to where they might have been had the harvest been good. Likewise, were the harvest exceptionally good, only a blockhead would insist on having the money stock boosted to prevent prices from falling — as if the decline were not a perfectly accurate reflection of the fact that goods had become cheaper. What goes for crop prices in an agricultural economy goes as well for prices of goods-in-general in a more diverse one. For that reason there’s at least an inkling of blockheadedness involved in the popular view that a stable and low inflation rate necessarily means that monetary policy is on track.
Fortunately there is also, as I’ve suggested elsewhere in this primer, a perfectly good alternative to treating departures of inflation from some stable and modest level as an indicator of excessive or deficient money. The alternative is to treat departures of the growth rate of overall spending on final goods from some stable and modest level as such an indicator. Unlike an increase in the rate of inflation, an increase in the growth rate of spending is an unambiguous symptom of an increase in the demand for goods, while a decline in the growth rate of spending is an unambiguous symptom of a slowing down of the progress of demand. There’s every reason to welcome adjustments to monetary policy aimed at preventing such fluctuations in aggregate demand; but there is no good reason for central bank actions that render aggregate demand less stable for the sake of maintaining a stable rate of inflation.
Policy was Too Easy, then Too Tight
With these preliminaries in mind, we’re in a position to consider the Fed’s part in the Great Recession, and especially whether it contributed to that event by making money too easy or too tight. The answer, I hope to convince you, is that the Great Recession is one of those instances in which the Fed erred first in one direction, and then in the other. Between 2003 and 2007, it poured fuel on the subprime fire by maintaining an excessively easy monetary policy stance. Then, in 2007–8, it lurched from an easy to a tight stance, and from there to an exceedingly tight stance, which was only partially corrected by its later forays into Quantitative Easing.
The evidence supporting these claims consists, first of all, of the behavior of total spending on final goods before, during, and after the crisis and, second, of a comparison of the Fed’s policy rates (or market rates closely reflecting those policy rates) during the same periods with corresponding estimates of the “natural” rate of interest. An excessively loose monetary stance will be reflected in unusually rapid spending growth and below-natural policy rates, whereas an excessively tight stance will be reflected in slower-than-usual spending growth and above-natural policy rates. Notice, again (for the point can’t be repeated too often), that these criteria don’t exclude the possibility that policy may be loose (or tight) even though the inflation rate isn’t rising (or falling), and even though the Fed’s policy rates appear high (or low) in an absolute sense, relative to past levels.
So, how did spending behaving during the late muddle? Nominal GDP and domestic final sales are two popular measures of total spending on output, each of which has its champions. The measures tend to be closely correlated; for simplicity’s sake, and also because I think it in some respects at least the better measure, I’ll look at domestic final sales. Here is a chart showing the growth rate of such sales along with the core PCE inflation rate from 1986 through this year; as usual the shaded vertical lines stand for NBER recessions:
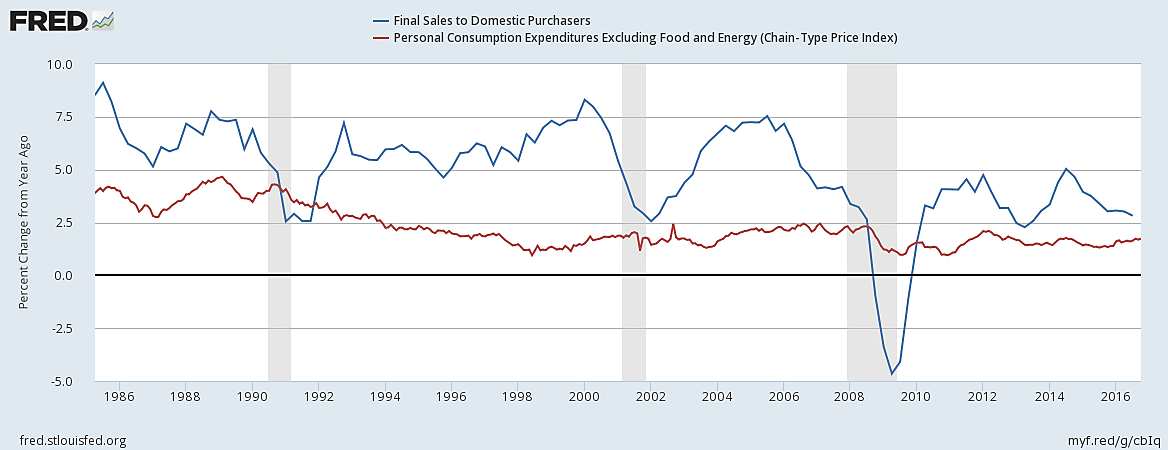
As you can see, both the recent and previous busts have involved substantial declines in spending growth, with an outright reduction in spending this last time around. They’ve also followed periods of above-average spending growth. In particular, according to our spending metric, money was easy at the height of the subprime boom, and not just tight but exceedingly tight during the bust. Since then it has remained on the tight side, relative to the historical trend, whereas the absolute decline in spending during the downturn actually called for some faster-than-usual growth afterwards to restore spending to its pre-bust level, or at least within spitting distance of it.
The coincidence of changes in the growth rate of spending and business cycles is, it bears saying, not mathematically inevitable: although booms and busts are just other names for upward and downward movements in the growth rate of real output (“y,” in the textbook algebra) around its trend, the fact that these movements accompany similar changes in spending (“Py”) reflects, not a mathematical necessity, but a more important, causal connection. It means that, instead of merely causing prices to increase, as a naive Quantity Theory of Money would have it (and as does tend to happen in the long run) more rapid spending tends to result in more real activity. That asset (as opposed to output) prices are likewise more closely correlated with spending than with inflation is also both easy to establish and not at all surprising once one realizes the connection between exceptionally vigorous spending and exceptional (though ultimately transitory) profits.
Natural Rate Estimates Tell the Same Story
And interest rates? Here the relevant comparison is, again, between the Federal Reserve’s policy rate — that is, the rate it “targeted,” and thereby kept at least roughly under its control — and estimates of that rate’s neutral or “natural” values. A convenient proxy for the first of these (in part because we have a consistent series for it) is the “effective” federal fund’s rate (ffr), which is the rate banks and other financial institutions actually charge one another for overnight loans. For the effective ffr’s “natural” counterpart, we have estimates by Vasco Cúrdia, of the Federal Reserve Bank of San Francisco. Because natural rate estimates are notoriously unreliable, the chart below shows Cúrdia’s median estimates (solid black line) as well as the upper and lower boundaries (dotted lines) of the 90% probability range for other possibly correct estimates. Finally, because these are estimates of the real (inflation-adjusted) natural short-term rate, I compare them to the effective funds rate minus the core PCE inflation rate. (Using core CPI instead makes virtually no difference):
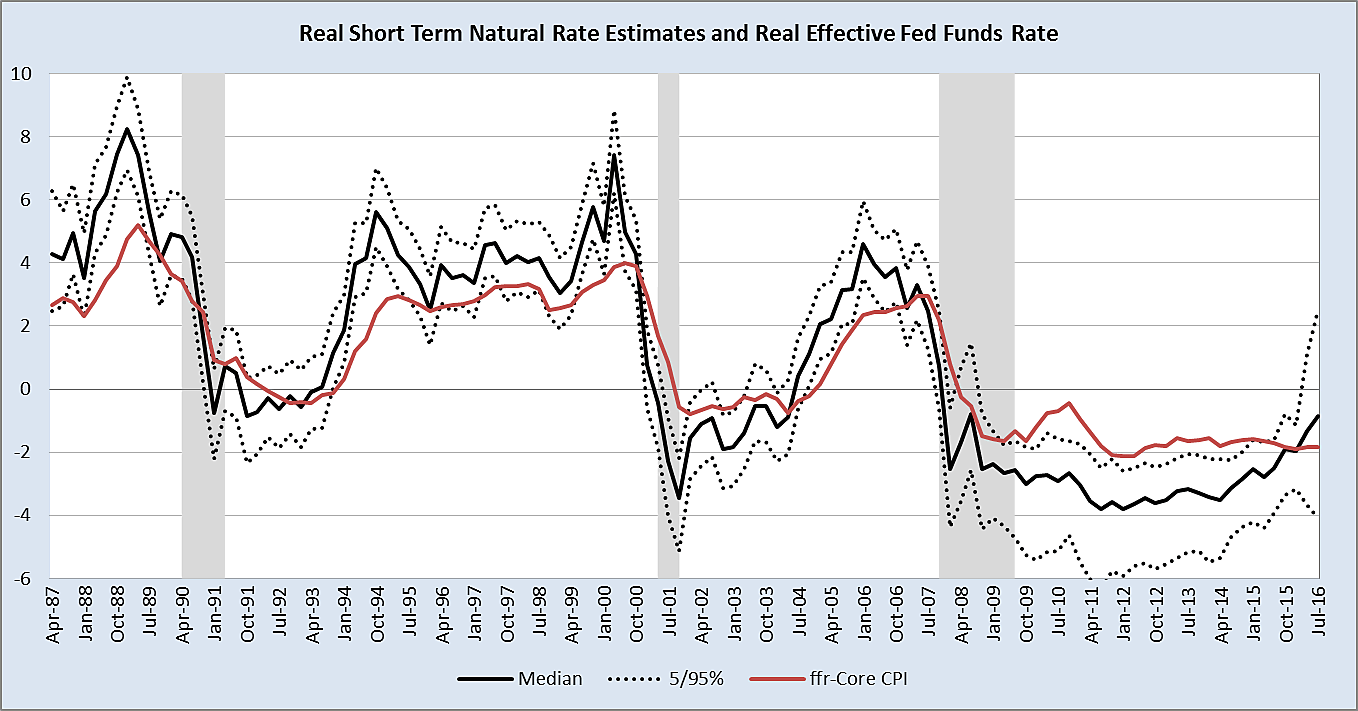
The story told by this chart is remarkably similar to that told by the preceding one, to wit, that booms have generally been associated with loose monetary policy, signified here by below-natural policy rates, while busts have been associated with tight monetary policy, or above-natural policy rates. In particular, policy appears to have gone from relatively tight to relatively loose some time during 2004, and to have remained loose throughout the remainder of the subprime boom. Then toward the end of 2007, it went from too loose to too tight, where it has remained throughout most of the period since. Just as remarkably, these conclusions hold for all but 10 percent of Cúrdia’s alternative natural rate estimates.
Having presented all this evidence, I hope I may be forgiven for daring to draw from it two simple lessons for monetary policy, namely: (1) that a stable inflation rate is no guarantee of overall economic stability, and (2) that such stability is best achieved having the Fed endeavor to maintain, not a steady rate of inflation, but a steady annual growth rate of final sales, or some similar spending measure, of something like 5 percent.[1]
Now for some caveats. I have argued that an excessively loose Fed policy stance contributed to the subprime boom, and that an excessively tight stance contributed to the subsequent crash and recession. That’s “contributed to,” not “caused.” I am not blaming the Fed for the subprime crisis. I understand very well that that crisis was the result of many factors, some of which may have been more important than the Fed’s actions.
I’ve also said nothing about the particular arguments and beliefs that informed the Fed’s conduct, or about the particular actions it took or devices it employed in order to give effect to what, in retrospect at least, appears to have been first an overly loose, and then an overly tight, stance. For some of the details, I refer readers to this paper written with David Beckworth and Berrak Bahadir, and to some of my previous Alt‑M posts, including this one, this one, this one, and this one.
Finally, I’ve said nothing about how in the course of the recent crisis the Fed abandoned, and perhaps was compelled to abandon, its traditional methods of monetary control. How and why that happened, and the new means of monetary control that the Fed has been employing ever since, will be the subjects of this primer’s next installment.
