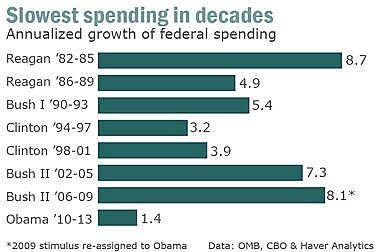
A financial columnist named Rex Nutting recently triggered a firestorm of controversy by claiming that Barack Obama is not a big spender.
Here’s the chart he prepared, which certainly seems to indicate that Obama is a fiscal conservative. Not only that, it shows that Republicans generally are the big spenders, while Democrats are frugal with other people’s money.
In some ways, these numbers don’t surprise me. I’ve explained before that Bush bears a lot of blame for the big expansion in the burden of government this century, and I’ve specifically pointed out that he deserves the blame for most of the higher spending from the 2009 fiscal year (which began October 1, 2008).
That being said, Nutting’s numbers seemed a bit nutty. Sorry, couldn’t resist. Nutting’s numbers actually seem accurate, including the fact that he decided that Obama should be responsible for $140 billion of the spending in Bush’s last fiscal year (a number he may have taken from one of my posts).
But sometimes accurate can be misleading, so I decided to dig into the data.
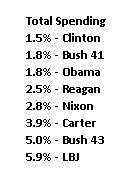
I went to the Historical Tables of the Budget from the Office of Management and Budget, and I calculated all the numbers for every President since LBJ (with the exception of Gerald Ford, whose 2‑year reign didn’t seem worth including).
But I corrected a big mistake in Nutting’s analysis. I adjusted the numbers for inflation, using OMB’s GDP deflator.
As you can see, this changes the results. My chart isn’t as pretty, but based on the inflation-adjusted average annual growth of outlays, it shows that Clinton was the most frugal president, followed by the first President Bush and Obama.
With his guns-n-butter Keynesianism, it’s no big surprise that LBJ ranks last. And “W” also gets a very low grade.
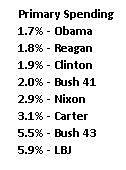
But then I figured we should take interest payments out of the budget and focus on inflation-adjusted “primary spending.” After all, Presidents shouldn’t be held responsible for the national debt that existed before they took office.
Looking at these numbers, it turns out that Obama does win the prize for being the most fiscally conservative president in recent memory. Reagan jumps to second place. Clinton is in third place, which won’t surprise people who watched this video, while W and LBJ again are in last place.
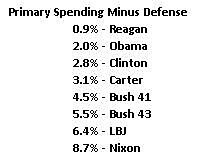
But I don’t want my Republican friends to get too angry with me, so let’s expand our analysis. Just as we don’t want to blame Presidents for net interest payments on debt that was accrued before their tenure, perhaps we should make sure they don’t get credit or blame for defense outlays that often are dictated by external events.
There’s obviously room for disagreement, but most people will agree that the Cold War and 9/11 meant higher defense spending, regardless of which party controlled the White House. Similarly, the collapse of the Soviet Empire inevitably meant lower military expenditures, regardless of whether Republicans or Democrats were in charge.
So let’s now look at primary spending after subtracting defense outlays (still adjusting for inflation, of course). All of a sudden, Reagan jumps to the top of the list by a comfortable margin. LBJ and W continue to score poorly, but Nixon takes over last place.
But it’s also worth noting that Obama still scores relatively well, beating Clinton for second place. Inflation-adjusted domestic spending (which is mostly what we’re measuring) has grown by 2.0 percent annually during his three years in office.
So does that mean Obama deserves re-election? Well, before you answer, I want to make one final calculation. Just as there are good reasons to exclude interest payments because they’re not something a president can control, we also should take a look at what spending would be if we don’t count the cost of bailouts.
To be sure, these types of expenditures can be controlled, but if we go with the assumption that the federal government was going to re-capitalize the banking system (whether using the good FDIC-resolution approach or the corrupt TARP approach), then it seems that Presidents shouldn’t get arbitrary blame or credit simply because some financial institutions failed during their tenure.
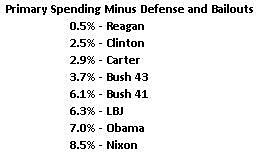
So let’s take the preceding set of numbers and subtract out the long-run numbers for deposit insurance, as well as the TARP outlays since 2009. And keep in mind that repayments of TARP monies (as well as deposit insurance premiums) show up in the budget as “negative spending.”
As you can see, this produces a remarkable result. All of a sudden, Obama drops from second to second-to-last.
This is because there was a lot of TARP spending in Bush’s last fiscal year (FY2009), which created an artificially high benchmark. And then repayments by banks during Obama’s fiscal years counted as negative spending.
When you subtract out the big TARP spending surge, as well as the repayments, then Bush 43 doesn’t look quite as bad (though still worse than Carter and Clinton), while Obama takes a big fall.
In other words, Obama’s track record does show that he favors an expanding social welfare state. Outlays on those programs have jumped by 7.0 percent annually. And that’s after adjusting for inflation! Not as bad as Nixon, but that’s not saying much since he was one of America’s most statist presidents.
Allow me to conclude with some caveats. None of the tables perfectly captures what any president’s fiscal record. Even my first table may be wrong if you want to blame or credit presidents for the inflation that occurs on their watch. And there certainly are strong arguments that bailout spending and defense spending are affected by presidential policies rather than external events.
And keep in mind that presidents don’t have full power over fiscal policy. The folks on Capitol Hill are the ones who actually enact the bills and appropriate the money.
Moreover, the federal government is akin to a big rusty cargo ship that is traveling in a certain direction, and presidents are like tugboats trying to nudge the boat one way or the other.
But enough equivocating. The four different tables at least show more clearly which presidents presided over faster-growing government or slower-growing government. More importantly, the various tables provide a good idea of where most of the new spending was taking place.
We can presumably say Reagan and Clinton were comparatively frugal, and we can also say that Nixon, LBJ, and Bush 43 were relatively profligate. As for Obama, I think his tugboat is pushing in the wrong direction, but it’s only apparent when you strip out the distorting budgetary impact of TARP.
