Millions of Americans move between states each year. These migration flows are influenced by numerous factors including job opportunities, climate, and housing costs. Interstate migration is also influenced by state and local taxes, as discussed in this recent study.
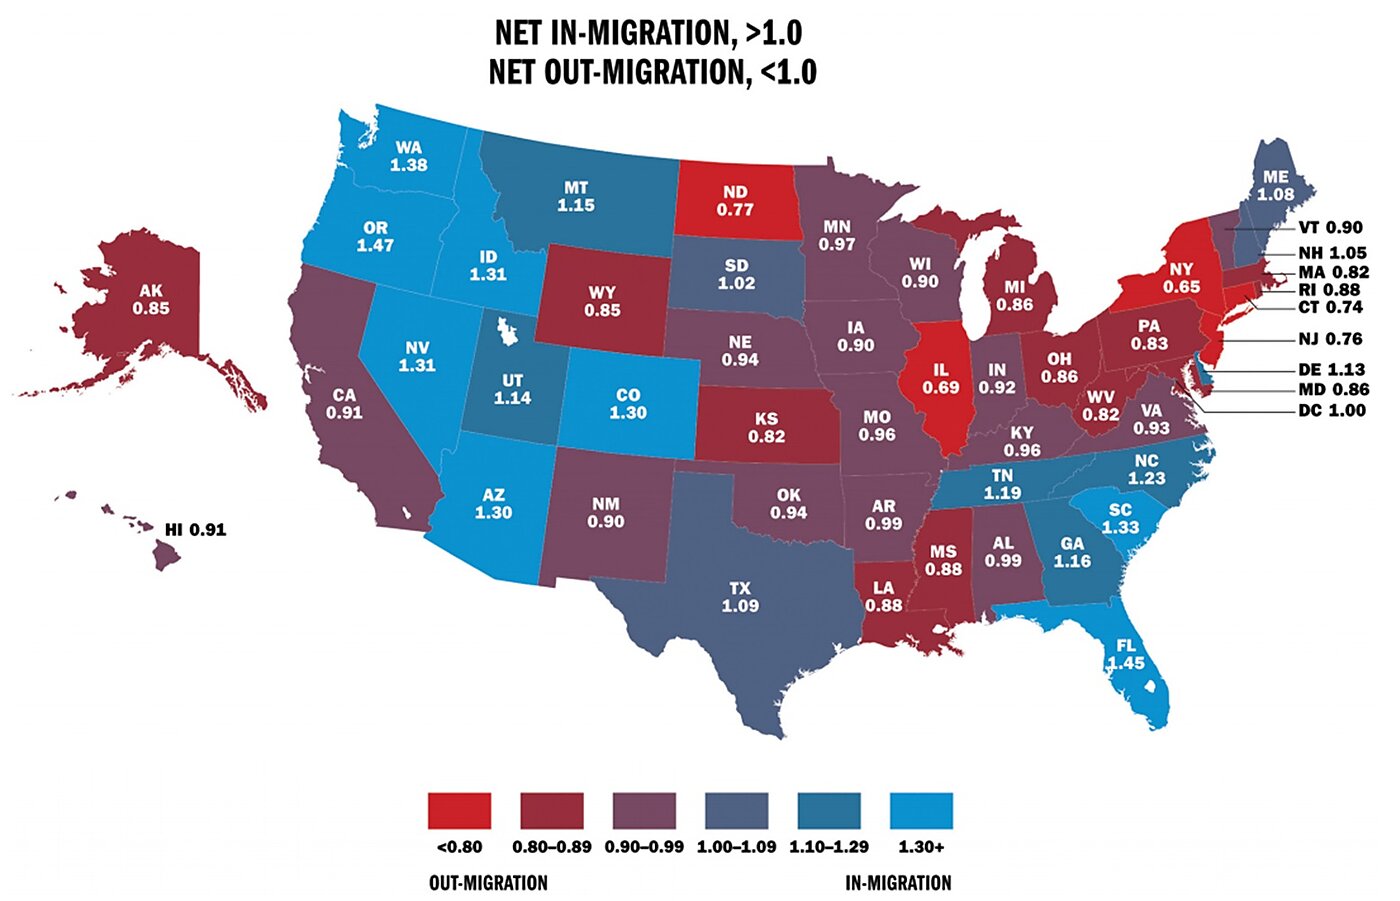
Internal Revenue Service data show that 2.8 percent of households moved to another state in 2016. The map below shows the net patterns of movement. People are leaving the red and purple states for the blue states.
The ratio of domestic gross in-migration to gross out-migration is shown for each state. In 2016, New York gained 142,722 households and lost 218,937 for a ratio of 0.65. Florida gained 307,022 households and lost 211,950 for a ratio of 1.45.
States losing population to other states have ratios of less than 1.0 and states gaining population have ratios of more than 1.0. People are generally moving out of the Northeast and Midwest to the South and West, but they are also leaving California, on net.
Here are some of the regional patterns:
- The Northeast. New Hampshire enjoys net in-migration. It is a low-tax state with no individual income tax. Higher-tax Connecticut, Massachusetts, Rhode Island, and Vermont suffer net out-migration.
- The Midwest. South Dakota enjoys modest net in-migration, while its higher-tax neighbors Iowa, Minnesota, and Nebraska suffer net out-migration. South Dakota is a low-tax state with no income tax. Neighbor Wyoming has net out-migration overall but has substantial net in-migration among high-earning households. Wyoming has no income tax.
- The Southeast. Kentucky has suffered net out-migration for years, while its neighbor Tennessee has enjoyed net in-migration. Kentucky is a relatively high-tax state, while Tennessee is a low-tax state with no individual income tax.
- The West. The largest destinations for out-migration from high-tax California are Texas, Washington, and Nevada—all low-tax states with no income taxes.
In this study, I divide the states between the 25 highest tax and 25 lowest tax, with taxes measured as state and local individual income, sales, and property taxes as a percent of personal income. In 2016, 286,431 households (with almost 600,000 people) moved, on net, from the 25 highest-tax states to the 25 lowest-tax states. Of the 25 highest-tax states, 24 of them had net out-migration in 2016. (Maine was the exception).
The 2017 federal tax reform law will likely intensify the patterns shown in the map of people moving from high-tax states to low-tax states. The law doubled standard deductions and capped state and local tax deductions. Those changes will reduce the number of households deducting state and local taxes from 42 million in 2017 to about 17 million in 2018. Those households will feel a larger bite from state and local taxes and become more sensitive to tax differences between the states.
