In 2014, the Cato Institute published a policy analysis that argued that Congress should create a work visa program that would allow states to select some of the foreign workers that the federal government admits—a model that Canada has used for decades. All states would benefit from this approach, since they all suffer from low federal caps on visas and since they all have the best knowledge of their local labor markets. But the states that will likely benefit the most are states with lower populations.
While there is no breakdown of the total number of visas issued to workers by state, we know how many workers enter each state annually. This number is imprecise as a measure of the total number of workers in each state because it double counts people who leave the state and reenter during the year, but it is still useful for looking at the distribution of workers among the states.
Figure 1 presents the distribution of all worker entries and entries of workers under the most important category—the H temporary work visa—by grouping the states into three roughly equal baskets: 1) the very large states with more than five percent of the entire U.S. population, 2) those in the middle with 2 to 5 percent, and 3) those with 2 percent or less. As is readily apparent, the big four states—California, Texas, New York, and Florida—receive a much higher percentage of workers than their share of the population. The middle group of states receives only slightly less than their population share for all worker entries.
On the other hand, the smallest states receive not only fewer workers in absolute terms, but disproportionately less than other states compared to their population. These 34 states are home to 30 percent of all Americans, but receive just 18.6 percent of guest workers overall—an 11.4 percent difference between population share and worker share. A similarly large gap can be seen for worker entries under the important H category.
Figure 1: Difference Between Share of All Worker Entries and Share of U.S. Population; Share of H Worker Entries and Share of the Population in 2014
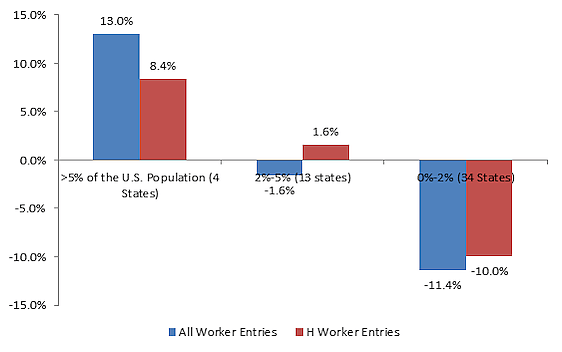
Sources: DHS (Entries); Census (Population)
Figure 2 breaks the third group in Figure 1—the smallest states—into two groups: 1) the 14 states with a population between 1 and 2 percent and 2) the 20 states with a population less than 1 percent of the overall U.S. population. As can be seen, it’s the higher-end of this less populous group that has the greatest disparity between population share and worker share. These are states like Iowa, Minnesota, Colorado, and Wisconsin. The 20 smallest states with populations between 0 percent and 1 of the population also had a difference, but it was a much smaller disparity—2.4 percent compared to 9 percent for states in the 1 to 2 percent range.
Figure 2: Difference Between State Share of U.S. Population and State Share of All Worker Entries and State Share of H Worker Entries in 2014
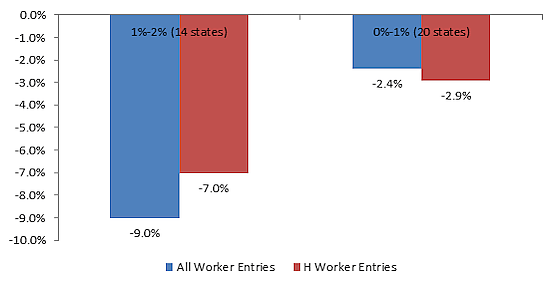
Source: See Figure 1
We know that this unequal distribution is not explained by differences in state labor market demand since domestic workers are actually moving from larger states to the smaller states. The real explanation is that larger and smaller states have different types of labor demand.
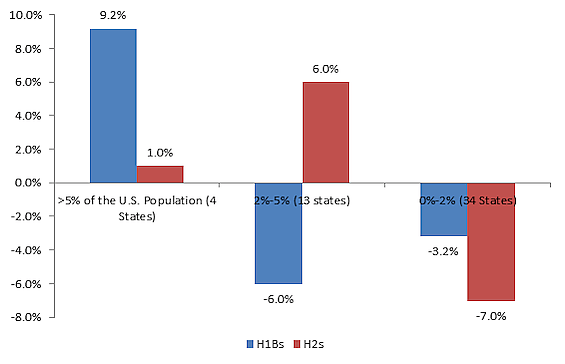
Figure 3 groups the states in the same manner as Figure 1, but breaks the H category into its two skill classes: H‑1B high skilled workers and H‑2s for lower skilled agricultural and non-agricultural workers (H‑2As and H‑2Bs). As you can see, the less populated states received a share of lesser skilled H‑2 workers in proportion to their populations, but received half as many H‑1Bs as their share of the population. For the more populous states, the reverse was true—they received much more high than low skilled workers.
Figure 3: Difference Between Share of H‑1B Higher-Skilled Worker Positions and State Share of U.S. Population; Share of H‑2 (H‑2A and H‑2B) Lesser-Skilled Worker Positions and State Share of U.S. Population in 2014
Sources: See Figure 1
We can take this conclusion further. Because H‑1B and H‑2B visas—the nonagricultural part of the H‑2 class—are capped, employers actually plan to receive far more workers than they actually get under the federal system. The first step toward applying for an H visa is submitting a certification of need for a certain position to be filled by a foreign worker. The Department of Labor either approves or denies this certification. If it’s approved, then the employer submits a request to the Department of Homeland Security for visas for the workers that it wants, if there are any visas remaining.
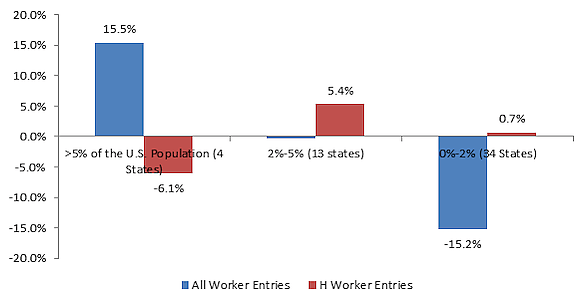
This certification process allows a very rough comparison between the demand for workers and the number of workers that each state receives. It is very imprecise because other factors limit the number of certifications that can be filed. All H‑1B certifications, for example, have to be filed on the same week six months before the workers arrive in the United States, so it underestimates total market demand. Yet as Figure 1 shows, smaller states received an appreciably lower share of worker entries than their shares of certifications of need. In other words, smaller states need a lot more lesser-skilled workers that they are unable to get under the current system.
Figure 4: Difference Between the Share of Certifications for H Worker Positions and Share of H Worker Entries in 2014 By State Share of U.S. Population
Source: DOL (Certifications), DHS
Overall the statistics on certifications for H workers reveal that every state is losing under the current system. On average, the Department of Labor approved an average of 22,438 certifications of need for H worker employment in 2014, but each state received only about 6,000 H workers in 2014. It is important to remember that this discrepancy is with all the current myriad federal rules and with no year-round visa available for lesser-skilled workers at all. The demand for workers surely far exceeds this amount.
The United States has a demand for foreign workers. While reforms to the federal system would be an improvement, Congress has consistently shown that it is incapable of estimating the needs of the states.
The table below presents all of this information for all 50 states and D.C.
Table: State Share of U.S. Population, Share of All Worker Entries, Share of H Temporary Worker Positions, Share of H‑1Bs, Share of H‑2s, Number of H‑2s, and Number of H‑1Bs in 2014
| % of US Pop | % of All Entries | % of Hs | % of H2s | % of H1Bs | H2 Certs. | H1B Certs | % H2 Certs | % H1B Certs | |
| California |
12.1% |
14.8% |
15.8% |
4.7% |
19.8% |
8,752 |
172,318 |
4.1% |
18.5% |
| Texas |
8.1% |
10.1% |
8.9% |
11.1% |
8.9% |
17,028 |
84,612 |
8.1% |
9.1% |
| New York |
6.3% |
14.0% |
7.3% |
2.8% |
14.0% |
7,898 |
76,105 |
3.7% |
8.2% |
| Florida |
6.1% |
6.7% |
4.3% |
7.9% |
5.2% |
20,056 |
29,447 |
9.5% |
3.2% |
| Illinois |
4.2% |
3.7% |
4.6% |
0.8% |
4.9% |
2,333 |
50,551 |
1.1% |
5.4% |
| Pennsylvania |
4.1% |
2.4% |
4.6% |
1.7% |
2.6% |
4,397 |
48,550 |
2.1% |
5.2% |
| Ohio |
3.7% |
2.0% |
2.7% |
1.1% |
2.0% |
2,715 |
28,518 |
1.3% |
3.1% |
| Michigan |
3.2% |
6.2% |
2.4% |
1.2% |
2.8% |
3,492 |
24,469 |
1.7% |
2.6% |
| Georgia |
3.1% |
2.4% |
4.1% |
4.5% |
2.5% |
12,166 |
34,841 |
5.8% |
3.7% |
| North Carolina |
3.1% |
2.1% |
3.8% |
6.2% |
1.9% |
18,380 |
24,539 |
8.7% |
2.6% |
| New Jersey |
2.8% |
3.9% |
6.0% |
1.1% |
6.6% |
3,252 |
65,505 |
1.5% |
7.0% |
| Virginia |
2.6% |
1.8% |
2.8% |
2.6% |
2.4% |
6,631 |
25,742 |
3.1% |
2.8% |
| Washington |
2.2% |
2.9% |
3.7% |
3.5% |
4.4% |
10,026 |
32,010 |
4.7% |
3.4% |
| Massachusetts |
2.1% |
3.7% |
3.2% |
1.0% |
4.2% |
3,230 |
33,473 |
1.5% |
3.6% |
| Indiana |
2.1% |
0.9% |
0.9% |
0.4% |
0.8% |
1,980 |
8,028 |
0.9% |
0.9% |
| Arizona |
2.1% |
2.8% |
1.7% |
17.0% |
1.2% |
5,710 |
13,382 |
2.7% |
1.4% |
| Tennessee |
2.1% |
1.0% |
1.4% |
1.6% |
0.7% |
3,426 |
12,868 |
1.6% |
1.4% |
| Missouri |
1.9% |
0.7% |
1.2% |
1.0% |
0.7% |
2,992 |
10,938 |
1.4% |
1.2% |
| Maryland |
1.9% |
1.4% |
1.7% |
1.5% |
1.5% |
4,436 |
14,788 |
2.1% |
1.6% |
| Wisconsin |
1.8% |
0.8% |
1.2% |
0.2% |
0.8% |
842 |
13,088 |
0.4% |
1.4% |
| Minnesota |
1.7% |
1.0% |
1.8% |
0.6% |
1.3% |
1,867 |
18,190 |
0.9% |
1.9% |
| Colorado |
1.6% |
1.3% |
1.5% |
2.2% |
1.0% |
5,225 |
12,263 |
2.5% |
1.3% |
| Alabama |
1.5% |
0.7% |
0.4% |
1.1% |
0.3% |
1,911 |
2,586 |
0.9% |
0.3% |
| South Carolina |
1.5% |
0.8% |
0.9% |
1.5% |
0.4% |
4,885 |
4,977 |
2.3% |
0.5% |
| Louisiana |
1.5% |
0.9% |
1.3% |
5.3% |
0.3% |
12,106 |
2,450 |
5.7% |
0.3% |
| Kentucky |
1.4% |
0.8% |
1.2% |
3.2% |
0.4% |
7,438 |
6,166 |
3.5% |
0.7% |
| Oregon |
1.2% |
0.7% |
0.8% |
0.6% |
0.7% |
1,639 |
7,505 |
0.8% |
0.8% |
| Oklahoma |
1.2% |
0.4% |
0.4% |
0.8% |
0.3% |
1,890 |
3,154 |
0.9% |
0.3% |
| Connecticut |
1.2% |
1.1% |
1.8% |
0.2% |
1.6% |
857 |
20,183 |
0.4% |
2.2% |
| Iowa |
1.0% |
0.4% |
0.6% |
0.5% |
0.4% |
1,267 |
5,885 |
0.6% |
0.6% |
| Mississippi |
1.0% |
0.4% |
0.5% |
2.1% |
0.1% |
5,131 |
868 |
2.4% |
0.1% |
| Arkansas |
0.9% |
0.5% |
0.9% |
2.0% |
0.4% |
5,203 |
5,355 |
2.5% |
0.6% |
| Kansas |
0.9% |
0.4% |
0.5% |
0.6% |
0.4% |
1,789 |
4,122 |
0.8% |
0.4% |
| Utah |
0.9% |
0.4% |
0.5% |
0.7% |
0.4% |
1,644 |
3,905 |
0.8% |
0.4% |
| Nevada |
0.9% |
0.6% |
0.4% |
0.9% |
0.2% |
2,138 |
2,305 |
1.0% |
0.2% |
| New Mexico |
0.7% |
0.2% |
0.1% |
0.1% |
0.1% |
241 |
1,328 |
0.1% |
0.1% |
| West Virginia |
0.6% |
0.1% |
0.1% |
0.0% |
0.1% |
136 |
574 |
0.1% |
0.1% |
| Nebraska |
0.6% |
0.7% |
0.4% |
0.3% |
0.7% |
1,604 |
3,032 |
0.8% |
0.3% |
| Idaho |
0.5% |
0.2% |
0.4% |
1.0% |
0.1% |
4,013 |
1,007 |
1.9% |
0.1% |
| Hawaii |
0.4% |
0.4% |
0.1% |
0.0% |
0.2% |
39 |
615 |
0.0% |
0.1% |
| Maine |
0.4% |
0.6% |
0.3% |
1.4% |
0.1% |
1,767 |
1,583 |
0.8% |
0.2% |
| New Hampshire |
0.4% |
0.3% |
0.3% |
0.6% |
0.3% |
497 |
2,879 |
0.2% |
0.3% |
| Rhode Island |
0.3% |
0.2% |
0.5% |
0.1% |
0.3% |
293 |
4,896 |
0.1% |
0.5% |
| Montana |
0.3% |
0.2% |
0.1% |
0.3% |
0.0% |
1,130 |
248 |
0.5% |
0.0% |
| Delaware |
0.3% |
0.3% |
0.5% |
0.2% |
0.3% |
359 |
5,139 |
0.2% |
0.6% |
| South Dakota |
0.3% |
0.1% |
0.2% |
0.4% |
0.1% |
1,675 |
479 |
0.8% |
0.1% |
| Alaska |
0.2% |
0.2% |
0.1% |
0.2% |
0.1% |
1,194 |
301 |
0.6% |
0.0% |
| North Dakota |
0.2% |
0.3% |
0.2% |
0.5% |
0.1% |
1,844 |
748 |
0.9% |
0.1% |
| Vermont |
0.2% |
0.3% |
0.1% |
0.4% |
0.1% |
1,074 |
637 |
0.5% |
0.1% |
| D.C. |
0.2% |
1.0% |
0.5% |
0.0% |
0.9% |
1 |
5,848 |
0.0% |
0.6% |
| Wyoming |
0.2% |
0.1% |
0.1% |
0.3% |
0.0% |
594 |
135 |
0.3% |
0.0% |
| Averages |
4,141 |
18,297 |
Sources: See Figure 1, Figure 4
