Global Science Report is a weekly feature from the Center for the Study of Science, where we highlight one or two important new items in the scientific literature or the popular media. For broader and more technical perspectives, consult our monthly “Current Wisdom.”
About a year and a half ago, we were co-authors (along with Dr. Oliver Frauenfeld from Texas A&M University) on a paper published in the Journal of Geophysical Research in which we presented a nearly 225-year reconstruction of surface snow melt across Greenland (Figure 1).
Our reconstruction was based on long-term temperature records from the southern Greenland coast along with historic indicators of the atmospheric circulation in the North Atlantic Ocean. We found that in addition to the period since about the year 2000, there was an extended (multi-decadal) period in the early portion of the 20th century where the amount of surface snowmelt was elevated above the long-term average. We concluded from this that since there did not appear to be a large increase in the rate of global sea level rise during the early 20th century period of elevated ice melt—a melt driven primarily by warmer than normal temperatures—that Greenland’s contribution to global sea level rise during the current period of high temperatures was likely to remain relatively “modest,” at least for the next few decades.
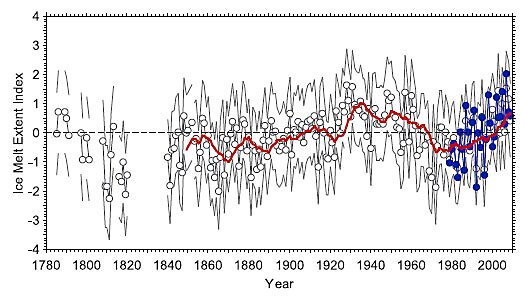
Figure 1. Reconstructed history of the total ice melt extent index over Greenland, 1784–2009. Observed values of the ice melt index (blue solid circles), reconstructed values of the ice melt index (gray open circles), the 10 year trailing moving average through the reconstructed and fitted values (thick red line), and the 95% upper and lower confidence bounds (thin gray lines) (from Frauenfeld et al., 2011).
Neither our methods, nor or findings were overly controversial—or so we thought.
Shortly after our paper was published, one of the reviewers of our paper, a noted snow/ice researcher who has spent a lot of time studying Greenland, Dr. Jason Box, came forwarded and denounced our work. On his blog (in posts he has subsequently removed), he attacked our work both from a scientific standpoint as well as deriding it with a few ad hominems (for example “Examining the 2nd [Knappenberger] and 3rd [Michaels] authors’ credentials, a climate change denialist pattern emerges”).
On both accounts we felt he was wrong (of course) and offered a rebuttal.
But perhaps the strongest argument that our results were scientifically sound comes from an ironic source—the results of new research findings from Jason Box himself!
These new findings from Box, although not yet fully available, have been incorporated into another research project that has recently been published (Gregory et al., 2012) and thus we can get a sneak peek at them.
The solid black line in Figure 2 (below) shows Box’s reconstruction of the sea level rise contribution from Greenland back into since the mid-1800s.
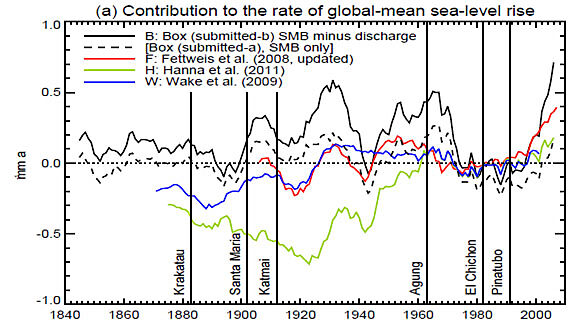
Figure 2. Various estimates of the time series of the Greenland ice-sheet mass contribution to global-mean sea-level rise. The reconstructions are plotted as ten-year running time-means of the sea-level equivalent of the rate of change of mass of the Greenland ice-sheet with respect to the mean of 1961–1990. The solid black line, labeled “B” is the net mass balance, including both surface mass balance and ice discharge from Jason Box. The horizontal dotted line indicates zero. The vertical lines indicate the years in which major volcanic eruptions occurred (from Gregory et al., 2012).
Notice the strong resemblance of Box’s reconstruction of the sea level contribution from Greenland with our reconstruction of the surface snow melt across Greenland. The snow melt/sea level contribution is currently very high, was relatively low in the 1970s, 1980s, and 1990s, was high from the mid-1920s through the late 1960s, and was lower in the 1800s.
Considering that there are other factors besides snowmelt (like snow accumulation and calving glaciers) that contribute to Greenland’s net contributions to sea level rise, the two curves are remarkably similar. This is a strong indication that whatever is driving snowmelt (regional temperature) is also driving the net sea level contribution.
All of which we wrote in our paper:
This record of ice melt indicates that the melt extent observed since the late 1990s is among the highest likely to have occurred since the late 18th century, although recent values are not statistically different from those common during the period 1923–1961, a period when summer temperatures along the southern coast of Greenland were similarly high as those experienced in recent years. Our reconstruction indicates that if the current trend toward increasing melt extent continues, total melt across the Greenland ice sheet will exceed historic values of the past two and a quarter centuries
…The forces acting in concert with ice melt across Greenland to produce higher global sea levels currently, should also have been acting during the extended high‐melt conditions from the mid‐1920s to the early 1960s.
And we also added this concerning the significance of Greenland’s contribution to the total global sea level rise:
[T]here is no indication that the increased contribution from the Greenland melt in the early to mid 20th century, a roughly 40 year interval when average annual melt was more or less equivalent to the average of the most recent 10 years (2000–2009), resulted in a rate of global sea level rise that exceeded ~mm/yr. This suggests that Greenland’s contribution to global sea level rise, even during multidecadal conditions as warm as during the past several years, is relatively modest.
Figure 3 (anther figure from the new paper from Gregory et al., 2012) shows the breakdown of the factors contributing to the global rise in sea level of the past century and a half. Greenland’s contribution (based on Box’s reconstruction) is the pale green line (labeled “Greenland‑B” in the legend). I think it is pretty fair to characterize this as “modest.”
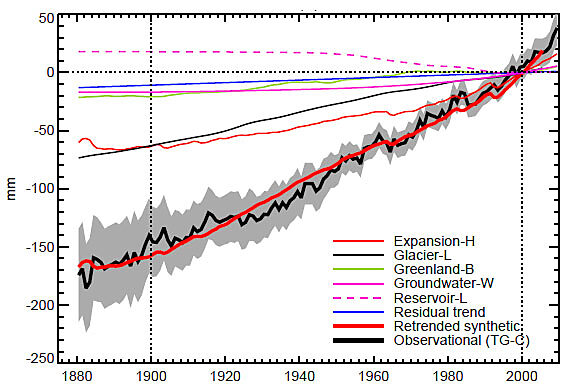
Figure 3. Observational (black) and a reconstructed (red) time series of global mean sea-level rise (thick lines, with 5–95% observational uncertainty shaded), also showing the contributions to the latter (thin lines), identified by the time series initials in the key (from Gregory et al., 2012).
Why was such a big deal was made about our research results and “denialist” credentials when subsequent results, made by the very person who went ad hominem, completely replicate our findings?
References:
Box, J. E., Greenland ice sheet mass balance reconstruction. Part III: Marine ice loss and total mass balance (1840–2010). Journal of Climate, submitted (as cited by Gregory et al., 2012).
Frauenfeld, O.W., P.C. Knappenberger, and P.J. Michaels, 2011. A reconstruction of annual Greenland ice melt extent, 1785–2009. Journal of Geophysical Research, 116, D08104, doi: 10.1029/2010JD014918.
Gregory, J., et al., 2012. Twentieth-century global-mean sea-level rise: is the whole greater than the sum of the parts? Journal of Climate, doi:10.1175/JCLI-D-12–00319.1, in press.
