Former Treasury Secretary Larry Summers, in June 4 testimony before the Senate Budget Committee, offers a scatter diagram which allegedly shows “that countries that pursued harsher austerity policies in recent years also had lower real GDP growth.” He acknowledges, but does not adequately explain, that the causality may well be backwards: Bond markets would not allow countries in severe economic distress (Portugal, Ireland, Greece and Spain) to continue financing deficits at the peak levels of 2010.
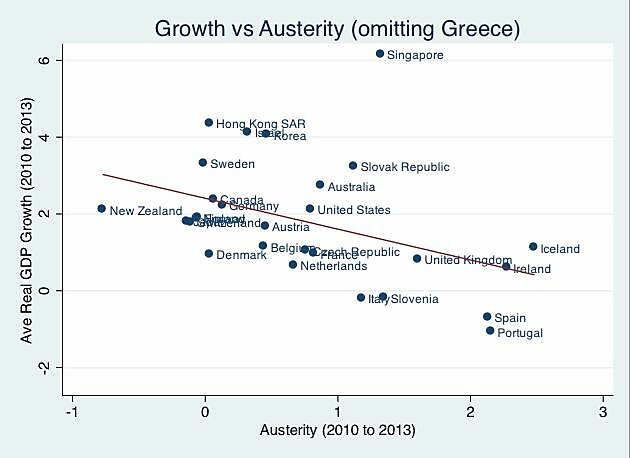
Summers defines “austerity” as the three-year change (regardless of the level) from 2010 to 2013 in cyclically-adjusted “primary” deficits (excluding interest expense) as a percent of potential GDP. His scatter diagram then compares those changes to average real GDP growth from 2010 to 2013, using unexplained estimates for 2013.
Measuring fiscal stimulus by the change in budget deficits means several countries with little or no budget deficit in both 2010 and 2013 appear as employing the most “fiscal stimulus” in Summers’ graph. Sweden’s deficit is estimated at 0.1 percent of GDP for 2013, according to The Economist, and was literally zero in 2010. Keeping the budget balanced puts Sweden on the admirable left side of Summers’ diagram – the side ostensibly choosing growth rather than austerity. Germany is another country Summers counts as avoiding austerity, even though Germany’s brief cyclically-adjusted deficit of 3.5 percent of GDP in 2010 was cut to zero in 2012–2013.
When it comes to real GDP Growth, Hong Kong, Singapore, the Slovak Republic and South Korea appear near the top of Summers’ graph. It is revealing that Hong Kong is also far to the left on the pro-growth side of the austerity axis. This may appear paradoxical since Hong Kong ran budget surpluses in 7 of the past 8 years, and will do so again in 2013. No amount of cyclical adjusting could turn chronic surpluses into deficits. Simply because Hong Kong has not switched from a big deficit to a smaller one, that alone suffices to place it among the least “austere” economies on list. Similarly, South Korea’s budget surplus is estimated at 1.3–1.4 percent of GDP in both 2010 and 2013, according to the OECD, but keeping the budget in surplus between those years counts as stimulative policy in Summers’ reckoning.
The Slovak Republic also looks relatively strong on the growth axis, though fare worse on the austerity index because the budget deficit was trimmed from 7.7 percent of GDP in 2010 to an OECD-estimated 2.4 percent in 2013. A better explanation for what motivates a vigorous private economy would be obvious if Keynesians ever stopped obsessing about government borrowing long enough to glance at the supply side: The highest income tax rate in the Slovak Republic just happens to be 19 percent, which is comparable to the 20 percent top tax rate in Singapore but higher than the 15 percent top tax rate in Hong Kong, Lithuania, Costa Rica or Mauritius, or the 13 percent flat tax in Russia.
It is a mystery how New Zealand shows up as the very best on the austerity axis – apparently the most stimulative fiscal policy of these two dozen countries. Now, it is true that New Zealand cut the highest income tax rate from 39 percent to 33 percent between 2008 and 2011, which certainly qualifies as stimulative in my incentive-based micro model. Using Summers’ criterion of changes in government borrowing, however, the OECD shows New Zealand’s deficit falling sharply from 7.5 percent of GDP in 2010 to 2.4 percent in 2013. Perhaps cyclical adjustment and exclusion of interest could transform that seemingly austere drop in New Zealand’s deficit into a stimulative increase, but that would nevertheless be odd.
The most austere countries on the right side of the austerity axis are also the most austere on my list (confounding Krugman’s simplistic description of an “austerian”) but for an entirely different reason. The austere countries are Ireland, Spain, Portugal and the United Kingdom, and maybe Iceland. Deficits aside, these countries became more austere and uncompetitive in terms of supply-side incentives because they all increased their highest income tax rates — from 36.7 to 46.2 percent in Iceland, from 41 to 48 percent in Ireland, from 43 to 52 percent in Spain, from 42 to 46.5 percent in Portugal, and from 40 to 50 percent in the U.K. Why is anyone still surprised when countries with high and rising tax rates experience flat or falling GDP growth?
Unlike most countries on the good side of the austerity axis, OECD-estimated 2013 deficits within the “austerity” camp (except Iceland) look large – 6.4 percent in Portugal, 6.9 percent of GDP in Spain, 7.1 percent in Britain and 7.5 percent in Ireland. Yet Summers’ measure of cyclically-adjusted primary deficits came down by a modest 1.5 to 2.5 percentage points from 2010 to 2013, which supposedly defines these increasingly indebted and overtaxed countries as brutally frugal.
The weakness of the whole exercise is illustrated by the way it makes Iceland and Ireland look nearly identical in terms of both deficit reduction and feeble GDP growth. Unlike Ireland, Iceland really did make deep cuts in spending which resulted in slashing the deficit to 0.2 percent of GDP in 2013, by an OECD estimate. Iceland’s 0.2 percent figure is scarcely comparable to Ireland’s 2013 deficit of 7.5 percent of GDP. But recall that it is change that matters and Ireland started with a deficit that even dwarfed what the U.S. borrowed in World War II.
Comparing deficits in 2010 with those in 2013 appears to make Ireland as austere as Iceland. But Ireland went crazy in late 2010 and bailed-out creditors and depositors in a half dozen banks. The bailouts were temporary, paid-out after a couple of years, so the Irish deficit has dropped to “only” 7.5 percent of GDP. Because Ireland is no longer borrowing 30.5 percent of GDP, as it did in 2010, any reduction in that obviously unbearable deficit counts as “austerity” by the Summers standard.
The other axis, showing a three-year average of GDP growth, also misleads. Iceland’s GDP growth picked up in 2011, yet averaging only the years 2010–2013 makes Iceland’s growth appear nearly as weak as Ireland’s because Ireland’s economy fell sooner and faster in 2008–2009 while Iceland’s crisis was deeper in 2010.
Summers’ imaginative method of defining what is or is not a fiscal stimulus implies that (1) countries like Hong Kong and South Korea which routinely run budget surpluses are secretly practicing the dark art of Keynesian stimulus, while (2) countries like Ireland must forever keep borrowing nearly a third of GDP or else stand accused of the dreaded “austerity.” This is Keynesian Krugmania at its worst.
