The student debt debate continues, and I thought it would be helpful to present some data to give a sense of how serious the problem is. Of course, when something goes from “fine” to “crisis” will vary from observer to observer, and for individual borrowers the weight of their debt could feel like anything from a financial gnat to an elephant.
I’ll highlight just a few things. Reporting total student debt – $1.7 trillion! – is common in media reports, but insufficient to grasp the situation. You need to at least know how many borrowers there are, what they borrowed for, and the expected payoff.
As itemized below, the payoff from a four-year degree and beyond tends to be high, with a recent bachelor’s grad who borrowed likely to see only 6.2 percent of their starting salary go to repaying their loan. And many undergrads – 45 percent – did not borrow. Also, grants now constitute a much larger share of undergraduate aid than loans.
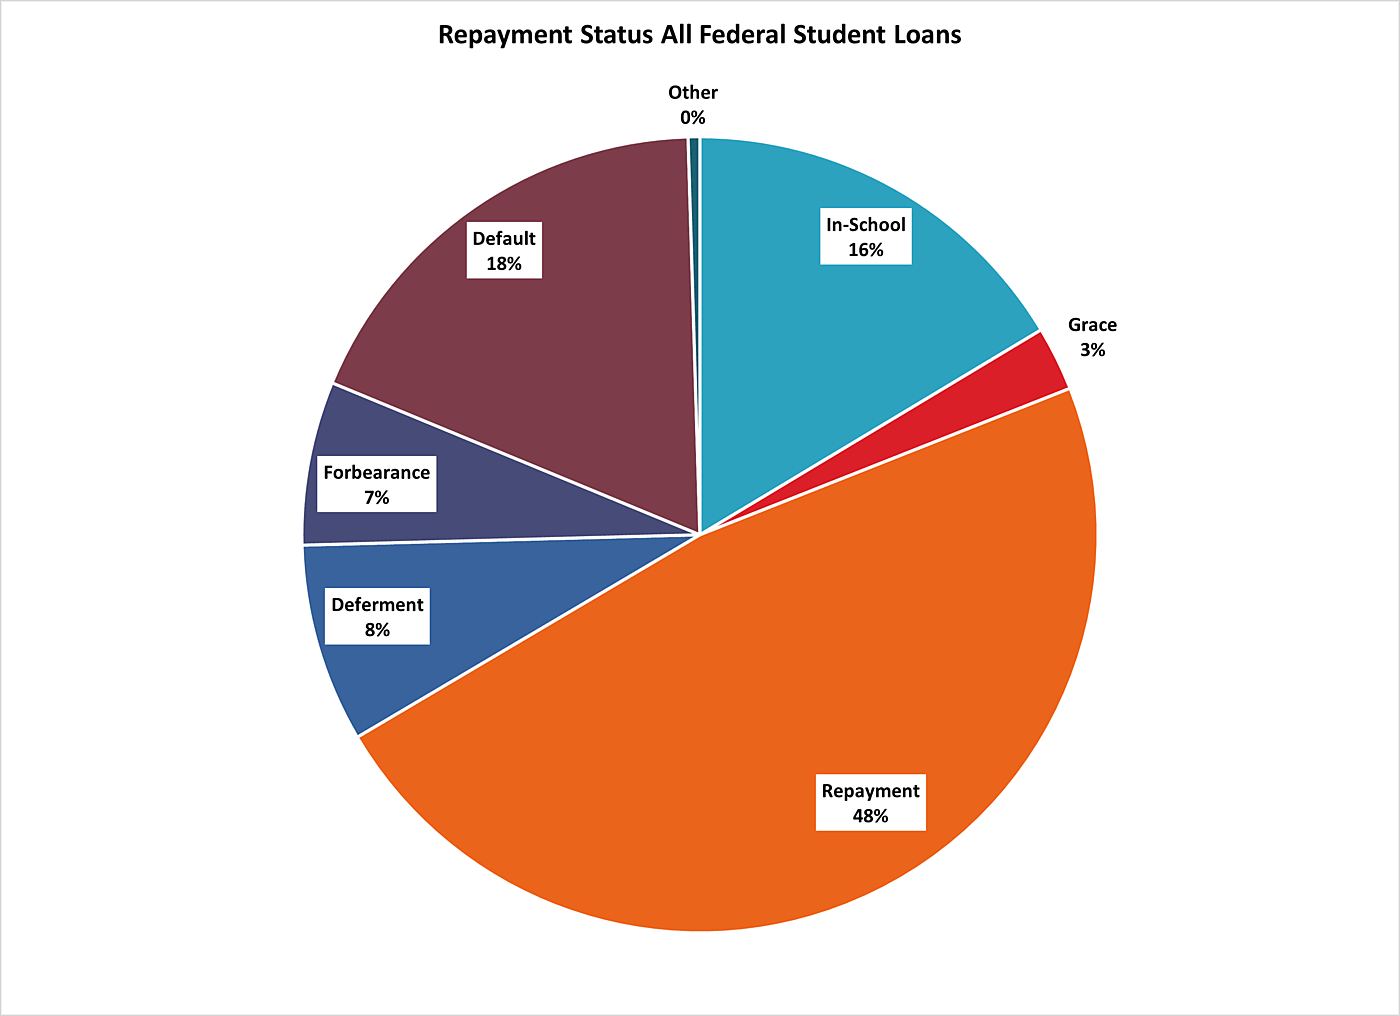
That said, there was a large share of debt that was not in “normal” repayment – in-school, grace, or repayment – right before COVID-19 hit and basically everyone was put in zero-interest forbearance. That suggests many people were having at least some difficulty repaying. Also, African Americans tend to have higher debt burdens than others, and shares of borrowers having repayment problems, supporting concerns about racial disparities. Still, there does not seem to be a student debt problem so great that it justifies mass cancellation, especially remembering that taxpayers will have to cover whatever is not repaid.
Note that all data are from the most recent sources of which I am aware, which run from 2016 to 2022.
Total Student Loan Debt: $1.7 trillion
Total Federal Student Loan Debt: $1.6 trillion
Total Federal Borrowers: 43.4 million
Share of Families Holding Student Debt: 21%
Federal Debt per Borrower: $37,004 (Total Federal Debt/Total Federal Borrowers)
Share of Bachelor’s Students Graduating with Debt: 55%
Average Bachelor’s Student Debt at Graduation, Just Borrowers: $28,400
Average Bachelor’s Student Debt at Graduation, All Grads: $15,600
Federal Loans as Share of All Aid, Undergrads: 26%
Federal Loans as Share of All Aid, Grad Students: 65%
Share of Undergrad Aid, Grants, Loans, Other Aid:


Lifetime Earnings above High-School-Only:
Some College: $0.3 million
Associate’s Degree: $0.4 million
Bachelor’s Degree: $1.2 million
Master’s Degree: $1.6 million
Doctoral Degree: $2.4 million
Professional Degree: $3.1 million
Average Starting Salary, New Bachelor’s Graduate: $55,260
Average Monthly Payment, Undergrad Who Borrowed, Standard (10-Year) Plan, 4% Interest: $287.54
Average Annual Payment As a Share of Salary [($287.54*12)/$55,260] * 100: 6.2%
Share of Undergraduate Enrollment, by Race:
White: 56%
African American: 14%
Hispanic: 19%
Asian: 6%
Other: 5%
Share of Graduate Enrollment, by Race:
White: 62%
African American: 14%
Hispanic: 12%
Asian: 8%
Other: 4%
White: $40,170
African American: $44,880
Hispanic: $30,890
Other: $40,400
Share of Population with Student Debt, by Race:
White: 20%
African American: 30%
Hispanic: 14%
Other: 24%
Repayment Status as of Q1 2020, Most Recent before COVID-19 Repayment Freeze:
Debt Paid or Not Behind, by Race:
White: 96%
African American: 80%
Hispanic: 77%
