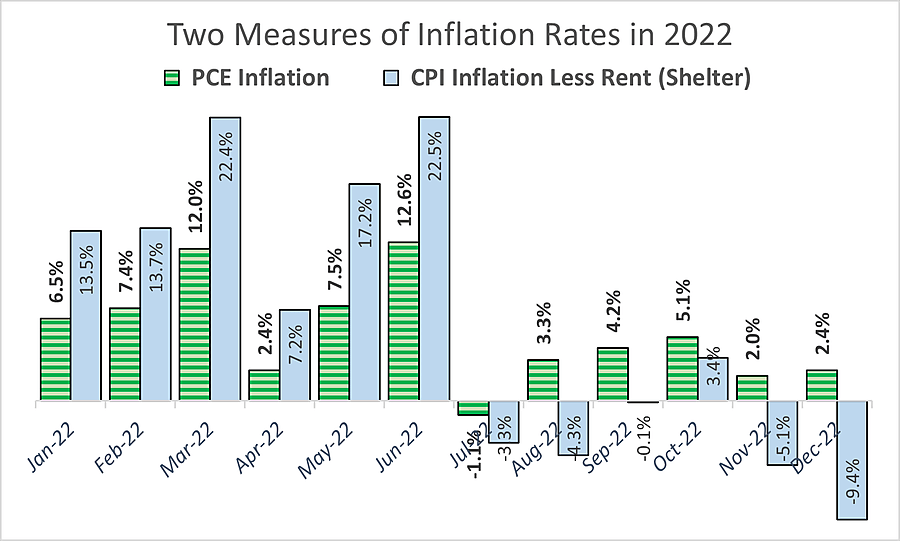
The PCE Inflation rate fell to 2.6 percent in the second half of 2022, down from 7.7 percent in the first half.
To conceal what happened when, that enormous change could be incompetently described as a 5.2 percent inflation rate over 12 months (which is what year-to-year changes do). But it would be almost impossible to say that inflation since June was no lower than it was before. Except, perhaps, for Jason Furman, President Obama’s former CEA Chairman.
“Fed tightening should go faster and further,” writes Furman, who advocates rushing to get the fed funds rate to “around 6 percent.” “Monetary policy operates with long and variable lags,” Furman agrees.
He argues, strangely, that “most of the tightening in financial conditions was already in place 10 months ago,” and therefore “it would be foolish to sit and wait for the medicine to work.” The 10-month dating is unintelligible and the logic topsy-turvy. The highest fed funds rate target was raised from 0.25 to 0.5 percent on May 5 and did not exceed 1 percent until June 16 when it was raised to 1.75 percent, then to 2.5 percent on July 28. Most of the tightening occurred in the second and third quarters when CPI inflation had fallen to 2.5 percent and 3.3 percent (but zero if we exclude lagged rent data).
He is quick to assure us that this “more aggressive course of action wouldn’t be an overreaction to volatile January data, which likely was affected by unusually warm weather and seasonal quirks.”
It is instead an overreaction to “the annualized three-month core inflation rate” which, of course, multiplies that admittedly dubious January data by twelve to magically turn it into a hypothetical annual rate of 6.8 percent (but only if the next 11 monthly increases were just as high as January’s). By adding that 6.8 percent preliminary estimate to comparable rates of 2.4 percent in December and 1.9 percent in November and dividing the total (11.1) by three gives an annualized three-month core inflation rate” of 3.7 percent—which Furman describes as 4.7 percent.
“Fundamentally, much of the economy’s underlying inflation” is, he claims, “a product of extremely tight labor markets leading to rapid wage gains that passed through as higher prices. These higher prices have also led to faster wage gains. Some call it a ‘wage-price spiral,’ but a better term is ‘wage-price persistence,’ because inflation stays high even after the demand surge goes away.”
For proof, Mr. Furman claims, “wage growth is currently running at an annual rate of about 5 percent” and predicts that “if the unemployment rate doesn’t rise, wages will continue to grow at that [5 percent] pace, which historically is associated with about 4 percent inflation.” That makes it clear that his policy advice is aimed lowering those supposedly persistent wage gains of “about 5” with substantially higher unemployment—a deliberate recession.
That curiously imprecise “about 5 percent” number flaunts Mr. Furman’s faith-based dedication to Phillips Curve theory and his cavalier indifference to facts. Average hourly earnings rose at an annual rate of 3.7 percent in January, after spiraling downward from 7.9 percent since last March. Last year, the Employment Cost Index had already spiraled down to 4.1 percent by the fourth quarter from 4.8 percent in the third and 6.5 percent in the second.
Furman talks only about core PCE inflation, less food and energy. But the Fed’s nebulous 2 percent target—as a long-term average (after 2026!)—is all-items inflation. “What makes the current inflation particularly troubling,” says Furman, “is that all the hoped-for saviors have come and gone without reducing underlying inflation very much. Inflation was supposed to go away after…energy prices came back down again after the Russian invasion…and yet the underlying inflation rate remains above 4.5 percent.” But the reason lower energy prices had less effect on his “underlying rate” is obviously because he excluded energy prices—by definition. But traditional core data has no clear predictive power for future inflation. Besides, his alleged “three-month core inflation” of 4.7 percent is totally reliant on mysterious math and a dubious one-month figure for January.
There is no clear reason for leaving energy out now that oil and natural gas prices stopped rising for the past seven months. The explosive rise of energy prices in the first half of 2022 was due to war—not “volatility”—and all those headlines about inflation being the “highest in 40 years” certainly included energy prices in both 2022 and 1982.
There is no excuse for excluding food prices now either. In fact, falling prices for many foods and services were among the many items removed from the January “trimmed-mean” PCE.
The one item that really does need to be excluded is antiquated estimates of rent and owner-equivalent rent that are called “shelter” in the CPI and “housing” in the PCE index. And this has been and remains a much bigger data distortion than Furman lets on.
Furman says, “The one story optimists can still cling to [aside from the unnoticed 2.6 percent inflation in the second half] is that the slowdown in rents on new leases will—with a lag—likely show up in slower housing inflation. But this factor is probably worth less than 1 percentage point off the inflation rate.”
The corruption of price indexes by lagged rent is easiest to see by excluding CPI shelter from that index. But rent/housing is also a huge problem with PCE inflation—grossly understating actual inflation in 2021 (by using 2020 rent data) and grossly overstating it 2022 and much of 2023. When anyone says they see little progress in a 2.6 percent PCE inflation in the second half, they are forgetting it would have been far below 2 percent were it not for the rapid rent inflation reported in the all indexes, particularly core measures (rent and OER is 42 percent of Core CPI).

