Today’s jobs numbers surprised on the upside. The unemployment rate fell to 3.6 percent and 263,000 jobs were created in April, exceeding analysts’ expectations.
Yet one indicator looks as if it still lags its pre-crisis peak: the employment-to-population ratio.
The headline rate for all aged 16+ topped out at 63.4 percent in December 2006. Today, it stands at just 60.6 percent (a 2.8 percent point decline). To translate that difference to hard numbers: if the employment rate of 2006 was replicated today, 7.4 million more people would be in work.
Should this be a matter of great concern? No. For there’s a simple explanation: demographics.
A structural decline in that ratio is what we would expect from an aging population. If one adjusts for the demographic change we have seen, the employment rate is already performing better today than at the height of the pre-crash boom.
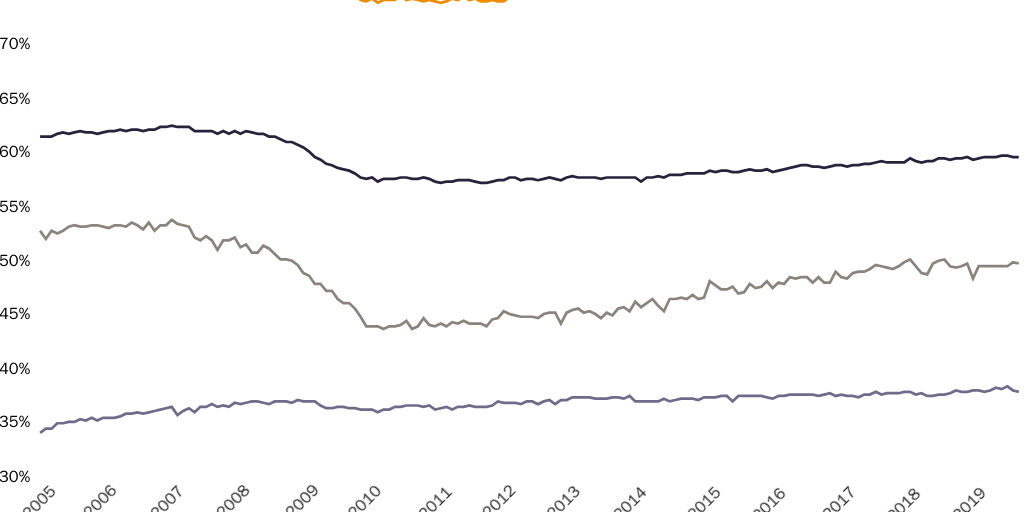
Consider Figure 1 below. The employment rate for prime age adults has near enough fully recovered. The rate for those over 55 actually peaked a couple of months ago but is still 3.8 percentage points higher than in December 2006. It’s only the youth employment-to-population ratio (16–24 year olds) that falls significantly below its pre-crash summit.
Yet the employment rate overall has remained subdued. That’s because a greater proportion of people today are in the older age groups. The elderly are much less likely to work. The Bureau of Labor Statistics (BLS) data shows those aged 50–54 have an employment rate of 77.9 percent. But this falls to 70.8 percent for those aged 55–59, to 56.6 percent for those aged 60–64 and then to just 32.9 percent for those aged 65–69.
So as an increasing share of the population has become old (the proportion of the total population over 55 has increased from 29.6 percent to 36.6 percent since 2006), we’d fully expect the headline employment rate to structurally fall, even if the proportion of that elderly population working rises somewhat.
To see how today’s employment rate truly compares with December 2006, we can make a simple calculation: estimating what the 2006 employment rate would have been if the economy back then faced today’s population structure. We can do this by applying today’s age group population data against the 2006 employment rates (the likelihood of being employed in the pre-crash economy).*
This calculation shows an employment rate in December 2006, adjusted to today’s population structure, of 60.5 percent. The actual employment rate today is 60.6 percent. Once one accounts for aging then, the employment rate today is stronger than its pre-financial crisis peak.
The same calculation limited to just those aged 20+ gives an even stronger result. The actual employment rate today is 62.8 percent, much higher than the estimated rate of 62.2 percent in 2006 if today’s population structure is applied.
The US labor market, on employment rates at least, appears to be performing better now than prior to the crash.
*The age groupings used for this overall calculation are non-seasonally adjusted data provided by BLS for ages 16–17, 18–19, 20–24, 25–34, 35–39, 40–44, 45–49, 50–54, 55–59, 60–64, 65–69, 70–74, 75+.
