Whether people in a society think that most others can be trusted seems to predict many positive social and economic outcomes. A common criticism of liberalized immigration is that the newcomers come from societies with low trust, so they might bring their low-trust attitudes with them, pass them on to their descendants, and leave our society with less trust, potentially reducing future economic growth.
Economist Bryan Caplan ran a recent exercise showing that immigrants and their descendants make substantial gains in trust, virtually assimilating by the second generation. In a similar vein, my research shows that trust levels among the second-generation are basically the same as Americans whose ancestors have been here for at least four generations according to survey responses on three related questions.
Caplan’s post provides a possible answer to the oddest question raised in my post: Why do third-generation Americans have the highest trust scores? Based on cliometric research, Caplan argues that the descendants of slaves in the United States have far lower levels of trust, similar to how African societies that were most afflicted by the slave trade have enduringly low trust rates today. All of the descendants of slaves in the United States have ancestors who arrived on our shores more that four generations ago, as legal slave importation ended in 1808.
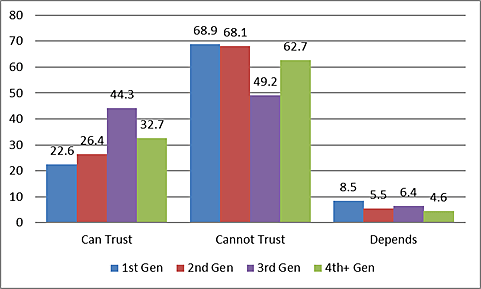
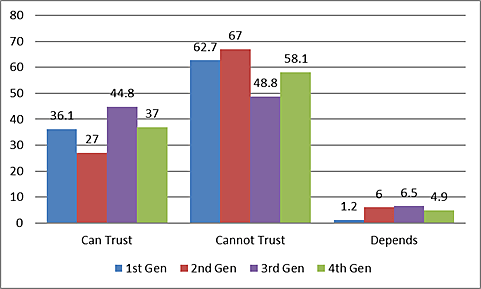
Excluding black respondents from the General Social Survey (GSS) on the question “Generally speaking, would you say that most people can be trusted or that you can’t be too careful in life?” does improve trust for Americans who can trace their lineage in the United States back at least four generations (all of their grandparents were born in the United States), but the biggest trust improvement is for the immigrants themselves. I limited my sample to the years 2004 to 2014 to focus on more recent immigrants. Figure 1 presents my original findings that include respondents of all races. Figure 2 excludes all black respondents.
Figure 1
Trust, Respondents of All Races Included, Years 2004–2014
Source: General Social Survey.
Figure 2
Trust, Black Respondents Excluded, Years 2004–2014
Source: General Social Survey.
When black respondents are excluded, “can trust” for Americans whose descendants have been here at least four generations goes from 32.7 percent to 37 percent while “cannot trust” drops from 62.7 percent to 58.1 percent. The answer “depends” shrinks the most from 8.5 percent to 1.2 percent. For immigrants, the “can trust” response shoots up from 22.6 percent to 36.1 percent while “cannot trust” drops from 68.9 percent to 62.7 percent. The GSS survey question shows that non-black immigrants have trust scores about the same as Americans whose grandparents were all born in the United States.


