Last week, the massive backlog in cases in the federal immigration courts crossed the half a million threshold. Immigrants currently being processed will have waited an average of almost two years for a judge to adjudicate their cases. The backlog has grown at a time when illegal immigration has fallen dramatically and the unauthorized population has shrunk.
Summary of Findings
- The immigration courts’ lower productivity accounts for all of the increase in pending cases since 2009.
- Immigration courts are finishing far fewer cases in recent years, completing just 58 percent as many cases in 2015 as they did in 2005.
- Nearly 100 percent of the decline in productivity from 2005 to 2016 occurred before the surge in unaccompanied children in 2014.
- The number of immigration judges, which has increased 18.5 percent from 2005 to the first quarter of 2016, does not explain the backlog.
- Each immigration judge completed just 60 percent as many cases in 2015 as they did in 2005.
- The complexity of the cases fails to explain the decreased efficiency. Immigration judges are on pace to complete just 44 percent as many cases in which they rule on the merits in 2016 as they did in 2006.
- In October 2012, the Department of Justice’s Inspector General called procedural continuances a “primary factor” in the court’s inefficiency.
More Immigration Judges Are Completing Fewer Cases
The most common explanation for the growing number of cases pending before the immigration courts is that the number of immigration judges has not kept up with the number of new cases. But as Figure 1 shows, the number of immigration judges has increased sharply since the early 2000s, yet the backlog continues to grow.
Figure 1: Immigration Court Judges and New Cases (FY 2001 to First Quarter of FY 2016)
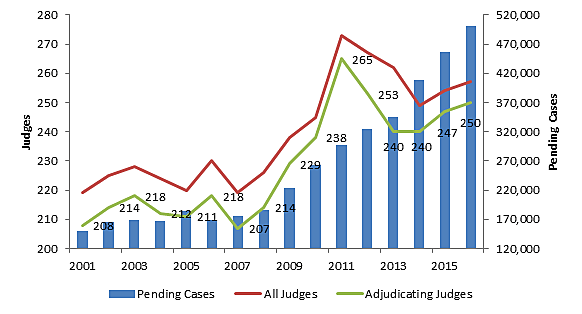
Sources: Judges: Office of Personnel Management via TRAC Immigration of Syracuse University (1998–2009), Director of the Executive Office for Immigration Review (2010–2016); Cases: TRAC Immigration of Syracuse University
The number of pending cases only grows when the immigration courts complete fewer cases than they receive. As can be seen in Figure 2, the courts were completing almost as many cases as they received from 2000 to 2008, and the backlog remained roughly constant. The courts became more productive from 2001 to 2006 before the trend reversed. They steadily finished fewer cases from 2007 to 2014. The lower productivity has persisted even years after the hiring surge from 2009 to 2011.
Figure 2: Completed Cases, New Cases, and Immigration Judges (2000–2016)
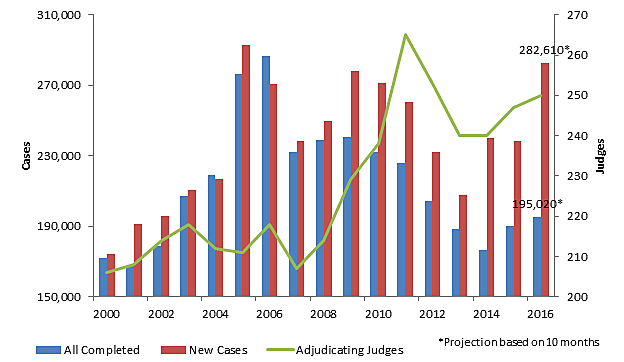
Source: Judges: See Figure 1, Completions: TRAC Immigration of Syracuse University (Completions sum all removals, voluntary departures, grants of relief, terminations, and closures)
Since fewer cases are being completed while more immigration judges are being added to the courts, the number of completions per judge has fallen to its lowest level ever. As early as October 2012, the Inspector General (IG) for the Department of Justice (DOJ) reported:
During this same 5‑year period [from 2006 to 2010] that the completion rate was declining, the number of immigration judges was increasing.… Despite the increase in judges, the overall efficiency of the courts did not improve.
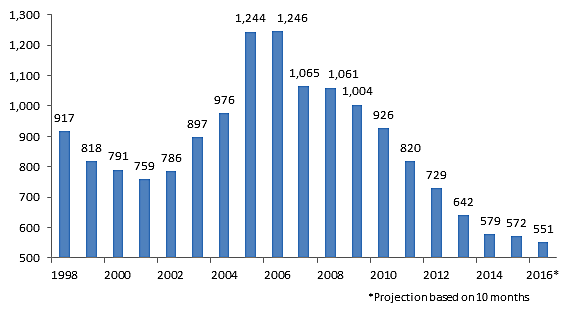
Figure 3 gives the number of cases that the average adjudicating immigration judge completed from 1998 to 2016.
Figure 3: Cases Completed Per Immigration Judge
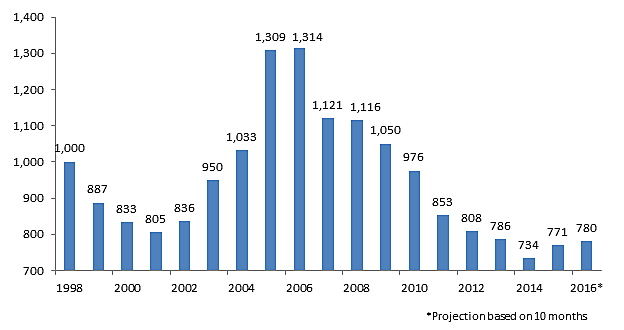
Source: See sources for Figures 1 and 2
If immigration judges completed the same number of cases from 2009 to 2016 that they averaged from 1998 to 2008, they would have finished 345,000 more cases than they actually did. Figure 4 shows the actual backlog compared to the projected backlog if judges had continued at their previous average. As can be seen, judges were completing above their historical average in 2009 before slowing down thereafter.
Figure 4: Actual Pending Immigration Case Backlog and Projected Case Backlog with Average Completion Rate Per Judge From 1998 to 2008
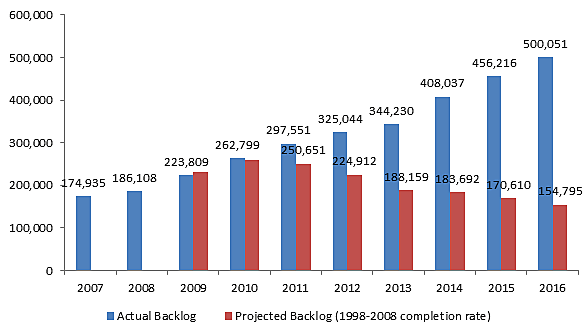
Source: Author’s calculation based on sources for Figures 1 and 2.
Recent Immigration Cases Are Not More Labor Intensive
One possible explanation for the backlog growth is that current immigration cases are more labor intensive for judges than in previous years. The least labor intensive cases are terminations and closures. Termination of proceedings is the court’s way of dropping charges against the immigrant. It is an act of prosecutorial discretion most used when the immigrant has eligibility for a visa. Closures set cases aside without a formal decision being rendered for or against the immigrant. It is another way of prioritizing the docket, but the case can be placed back on the calendar at any time.
In March 2013, the Chief Immigration Judge Brian O’Leary told immigration judges to close more cases as a “legitimate method of… preserving limited adjudicative resources.” As Figure 5 shows, the collapse in court productivity actually coincides with a large increase in the number of cases being administratively closed or terminated from 2009 to 2016. While terminations saw a twofold increase, and closures a fivefold increase, removals and voluntary departures fell by half, and findings in favor of relief by 40 percent.
Figure 5: Immigration Court Outcomes—Removals and Voluntary Departures, Relief, and Closures and Terminations (1998 to 2016)
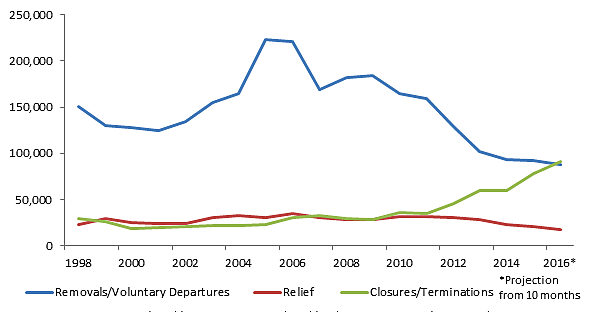
Source: TRAC Immigration of Syracuse University
While terminations could be seen as a “completion” because the court’s jurisdiction over the case is removed, administrative closures do not actually conclude the court’s business with the case. The immigrant is still under the jurisdiction of the court, and the court can place the case back on the docket at any time. In its October 2012 report, DOJ’s Inspector General chastised the courts for including closures as “completions.” The whole point of administrative closure is to increase the processing capacity of the court, yet as Figure 6 shows, focusing solely on cases in which the courts removed their jurisdiction demonstrates an even steeper decline in productivity.
Figure 6: Non-Closure Court Cases Completed Per Immigration Judge (1998–2016)
Source: TRAC Immigration of Syracuse University
The courts closed almost 28,000 more cases per year from 2012 to 2016 than they did from 1998 to 2011—138,000 in total. If the courts had completed as many non-closure cases as they did during the earlier period, while closing as many more cases as they did during the later period, the backlog would be gone entirely.
Asylum Seekers and Unaccompanied Children Have Not Caused the Backlog
The most difficult type of case is one in which the immigrant puts forward a claim of asylum in the United States, asserting a fear of persecution in their home country. These cases require a significant time for the immigrant to gather any evidence and find and present witnesses, and for Homeland Security to evaluate or rebut the claim. But during the key period from 2005 to 2011, there was no increase in the number of asylum decisions—denied or affirmed—in the courts. In fact, the number of decisions declined by 36.8 percent.
Figure 7: Asylum Decisions in Immigration Court, Total Decisions, and Asylum Grant Rate (2001–2014)
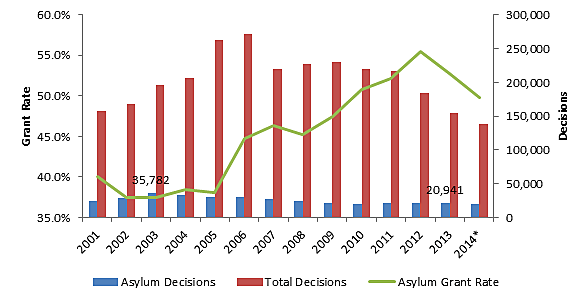
Sources: TRAC Immigration of Syracuse University
The administration has placed most of the blame for the backlog on those asylum seekers who claim a “credible fear” of persecution and unaccompanied alien children (UACs) coming to the border. Juan Osuna, the head of the immigration courts, told Congress in December 2015 that “the 2014 border surge put unprecedented pressures on EOIR.” That year, the director decided to fast track cases involving children, putting them in front of the line. The problem with this explanation, however, is that almost the entire decline in productivity occurred before the surge. In fact, Figure 7 shows that 2014 actually marked the end of the rapid decline in productivity, rather than its start.
Figure 8: UACs, Credible Fear Claims, and Non-Closure Completed Cases Per Immigration Judge
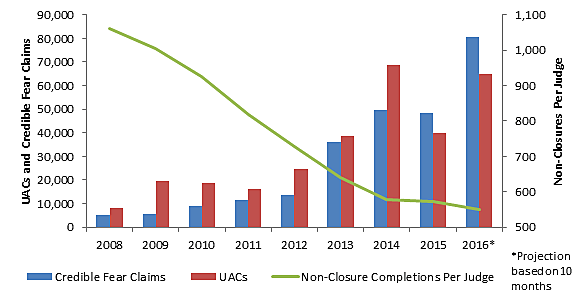
Source: Competitions: TRAC Immigration of Syracuse University; UACs: Customs and Border Protection (2008–2011, 2012-June 2016); Credible Fear: U.S. Citizenship and Immigration Services (2009-April 2016), Rempel (2008).
It’s also inaccurate to state that the courts have not previously handled a similarly rapid growth in their caseload. In 2005 and 2006, an influx of non-Mexican arrivals from Central America and Brazil resulted in a truly unprecedented jump in new cases. Similar to the UACs and women with children cases in 2014, the courts prioritized processing them. As Figure 9 demonstrates, the courts saw nearly 100,000 more new cases in those two years than in 2014 and 2015 and, despite having 12 percent fewer judges, processed 97.1 percent of them compared to 76.5 percent in 2014 and 2015.
Figure 9: Immigration Judges, New Cases, Completed Cases (2005, 2006, 2014, 2015)
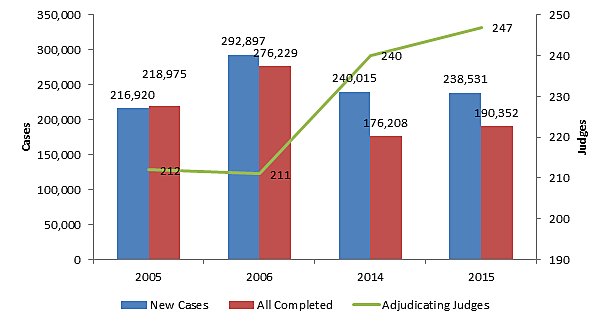
Sources: See Figure 3
Immigration court proceedings initiated based on a claim of criminality tend to be more labor intensive as well, but again there was no increase in the number of criminal removal proceedings during the key period from 2006–2014.
Figure 10: Criminal Charges and Total Immigration Court Non-Closure Completions (2001–2016)
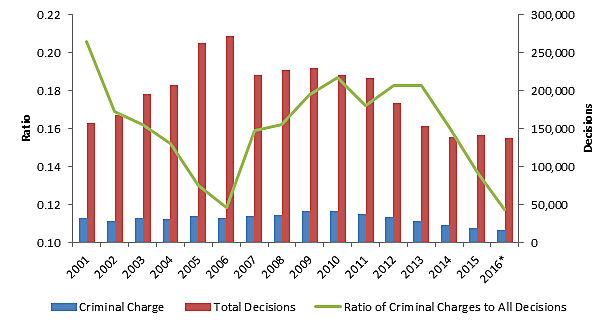
Source: TRAC Immigration of Syracuse University (Projected for 2016)
Courts Are Spending More Time Not Deciding Cases
Because courts are not completing as many cases, they are clearly spending more time on other matters. The share of all court activities—proceedings, motions, bond hearings—spent on decisions in which the judge made a decision on the merits of the case, as opposed to deciding procedural matters, steadily declined from 2007 to 2011.
Figure 11: Merits Decisions and Other Court Hearings as a Share of All Hearings (2007–2011)
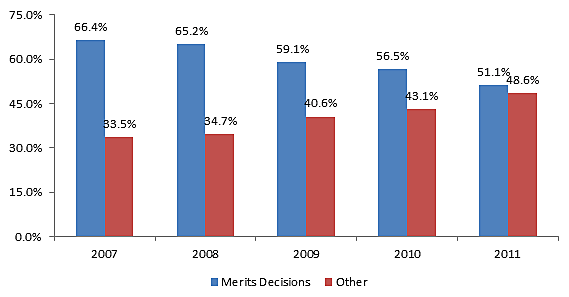
Source: Benson and Wheeler.
The other hearings that saw the largest increases were incomplete proceedings and other completed proceedings, such as a change of venue, that did not end with a merits decision. Bond hearings also saw a large increase over the period, while other motions held constant.
Figure 12: Non-Merits Decision Hearings as a Share of all Hearings (2007–2011)
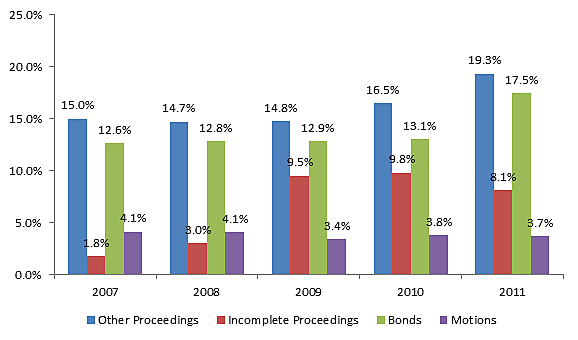
Source: Benson and Wheeler.
As can be inferred from the incomplete proceedings number, judges are postponing hearings at a much greater rate in recent years. As Figure 13 demonstrates, the number of continuances relative to the number of completed proceedings—which includes the growing number of changes of venue and other non-merits decision hearings—trended upward during the key period in which court productivity sank.
Figure 13: Ratio of Continuances to Completed Proceedings (2005, 2008, 2010)
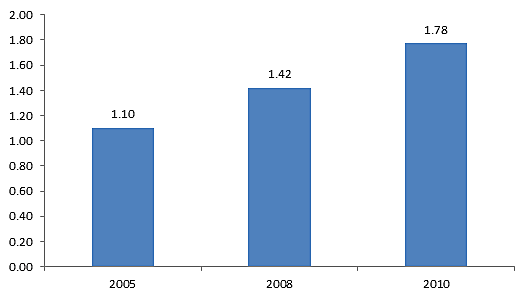
Source: Benson and Wheeler.
In its October 2012 report, DOJ’s IG found that “frequent and lengthy continuances are a primary factor contributing to case processing times.” Judges granted continuances in about half of the sample that the IG reviewed, and those cases were delayed an average of 368 days. In a majority of cases, the immigrants initiated the request for continuance, but their share of such requests has declined, while DHS prosecutors initiated the vast majority of other requests (Figure 14).
Figure 14: Sources of Continuances in Immigration Court (2005, 2008, 2010, 2011)
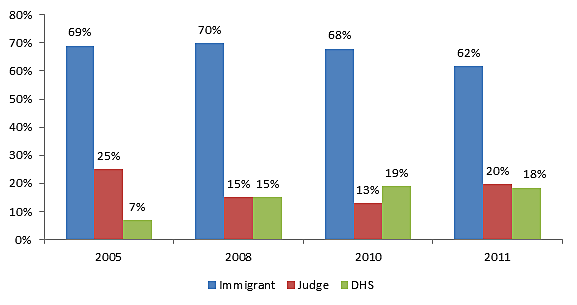
Source: 2005–2010: Benson and Wheeler; 2011: Office of the Inspector General for the Department of Justice. October 2012.
In 2011, time to seek representation was the most common reason immigrants asked for continuances (23 percent) followed closely by more time to prepare their cases (21 percent). The DOJ’s IG report stated, “EOIR advised us that a lack of representation can significantly delay proceedings because of the extra time needed to provide explanations to, and solicit information from, the aliens.” But lower representation does not appear to have been a factor in lower productivity. The share of represented cases actually increased significantly from about 32 percent to 45 percent from 2009 to 2012.
This raises the possibility that representation itself slows down the process, but yet again, this appears to be off the mark. The absolute number of represented cases moved only slightly upwards from 74,955 to 76,336 (Figure 15). As the study that documented these trends concluded, “increasing representation rates appear to be more a matter of decreasing volume of judicial decisions, rather than increasing involvement of attorney representatives.”
Figure 15: Representation in Immigration Courts in Cases Decided on the Merits
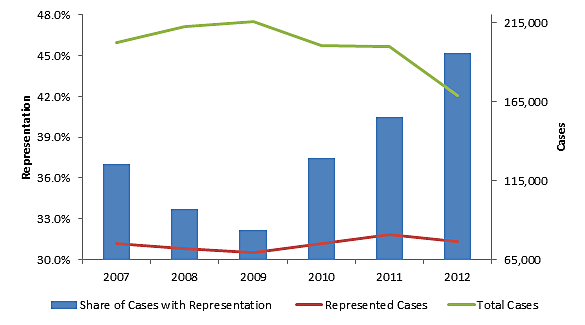
Source: Eagly, Ingrid and Shafer, Steven.
While immigrants were more likely to request continuances, Homeland Security prosecutor-initiated delays were 12 percent longer in duration. These delays were mainly necessary to finish background checks and forensic analysis, which was also the longest form of delay (132 days). Although an increase in wait times for DHS processing of visa applications occurred in the middle of the period when court efficiency declined, the fact that wait times have since reverted back to their norms without a corresponding increase in efficiency supports the idea that it was not a major factor in the court backlog.
Chief Judge O’Leary’s March 2013 letter to immigration judges stated that “it is beyond dispute that multiple continuances result in delay in the individual case, and when viewed across the entire immigration court system, exacerbate our already crowded dockets.” He clarified the legal standards for granting continuances in the clear hopes that judges would more critically assess requests for continuance. While it is unclear if this happened immediately or not, the decision to expedite the cases of unaccompanied alien children and women with children resulted in a 16-day drop in the median first continuance.
Additional Considerations
Several reports and congressional testimony have reviewed the efficiency and effectiveness of the immigration courts in recent years (see here, here, here, here, here, here, here, and here). These reports provide a large number of recommendations far beyond what can be evaluated in this survey. Suffice it to say that they detail a variety of ways in which the courts suffer from structural deficiencies that prevent it from completing their task as well as they should given the resources available.
Two factors should be given particular attention. First, resources are not distributed proportionately to the amount of cases being filed in jurisdictions creating wild variations in the court backlog across the country—292 days in North Carolina but 965 in Colorado. Second, unlike other courts, defendants in immigration courts lack court-provided legal representation, which results in unnecessary delays for immigrants to find counsel.
