Illegal immigration is at its lowest point since the Great Depression. President Trump has claimed success, but nearly all of the decrease occurred under prior administrations. The president’s campaign rhetoric does appear to have caused a small increase in illegal immigration prior to assuming office. Because immigrants moved up their arrival dates a few months, the typical amount in illegal entries failed to materialize in the spring. But these recent changes are small in the big picture: 98.2 percent of the reduction in illegal immigration from 1986 to 2017 occurred before Trump assumed office.
Naturally, illegal border crossings are difficult to measure. The only consistently reported data are the number of immigrants that Border Patrol catches attempting to cross. Border Patrol has concluded that the number of people who make it across is proportional to the number of people it catches. All else being equal, more apprehensions mean more total crossers. Of course, the agency could catch more people because it has deployed more agents. But we can control for the level of enforcement by focusing on the number of people each agent catches.
Figure 1 provides the number of people that each Border Patrol agent brought into their custody during each of the last 60 years. As it shows, illegal immigration peaked in the mid-1980s. From 1977 to 1986, each border agent apprehended almost 400 people per year. After the 1986 amnesty legislation that authorized new agents and walls, the flow fell at a fairly steady rate. Following the housing bubble burst, the 2009 recession, and the concomitant border buildup, the flow has essentially flatlined. In 2016, each border agent nabbed fewer than 17 people over the course of the entire year. That’s one apprehension every two and a half weeks of work. The “crisis” is over and has been for a decade.
Figure 1: Apprehensions Per Border Patrol Agent, FY 1957–2017
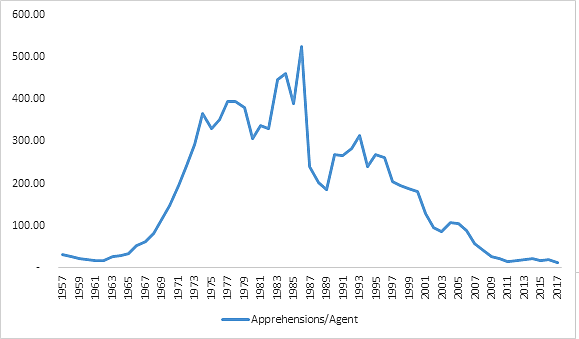
Sources: Apprehensions 1957–2016: Border Patrol; Apprehensions FY 2017 (projected from October-June data): Border Patrol; Border Patrol Staffing: Border Patrol, INS Statistical Yearbooks and INS Annual Reports
Following Trump’s election, the flow did fall further, but this was mostly a continuation of the existing trend. Before Trump assumed office, there was a slight departure from the trend (represented as a dotted line in the Figure 2), but this June’s apprehension figures are roughly where we would expect based on the last decade and a half of data. I interpret this to mean that we saw a Trump effect before he assumed office, when some additional asylum seekers and immigrants came to the border a few months ahead of schedule in fear of the changes that he might bring. But the effect dissipated after he assumed office.
Figure 2: Monthly Apprehensions Per Border Agent and Exponential Trendline, October 1999 to July 2017
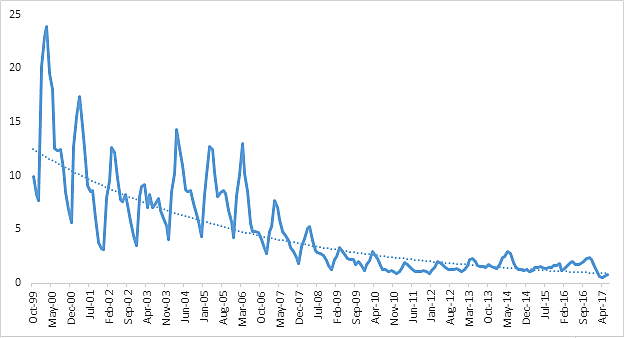
Sources: Apprehensions FY 2000–16: Border Patrol; Apprehensions FY 2017: Border Patrol; Border Patrol Staffing: Border Patrol
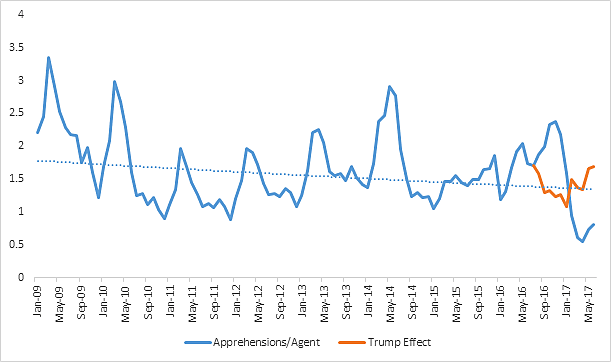
Zooming in further on the Obama and Trump administration months only reinforces the interpretation of a pre-election Trump effect (Figure 3). In every pre-Trump year, illegal flows spiked during the month of May or earlier (a phenomenon which goes back to at least 2000). Donald Trump launched his campaign in June 2015. Instead of waiting until the spring, immigrants started coming to the border during the winter months for the first time, peaking in December. In 2016, there was the typical spike in the spring, but then after Trump won the Republican nomination, apprehensions rose quickly peaking in November at well over the Spring numbers.
Figure 3: Monthly Apprehensions Per Agent and Exponential Trendline, January 2009 to June 2017
Sources: See Figure 2
There were 90,000 more apprehensions made from August 2016 to January 2017 than in the pre-Trump August 2014 to January 2015. Assuming that this is a sign of a Trump effect—and immigrants moved their travel plans up roughly six months earlier than they otherwise would have—each month from February to June under the Trump administration would have seen 15,000 or so more arrivals and from August to January 15,000 fewer per month. This would place the first months of the new president’s tenure right about on the trend line from the Obama administration (Orange line in Figure 3).
In this case, Trump is benefiting not so much from his current rhetoric or policies, but from his rhetoric on the campaign trail. Immigrants chose to come earlier than they would have, and so the normal spring rush failed to materialize. If this is the case, then it’s possible that apprehensions will return to the normal trend next year. Of course, the administration’s new policies may have started to make an impact by that point. Only time will tell.
Even if the normal trend returns, large scale illegal immigration is over. Whoever deserves credit, the job is done. Congress should move on and start talking about real issues.
