The Consumer Price Index (CPI‑U) for “All Items” rose by about 23 percent over the course of the last decade.* That implies that—on average—a person whose salary was $50,000 in 2000 saw his real income rise (fall) if his nominal income was more (less) than $61,500 in 2009. By the same measure, an hourly worker earning $20 per hour in 2000 had to be earning more than $24.60 per hour in 2009 to have experienced an increase in his real wage.
Of course the CPI‑U for “All Items” reflects the prices of a broad basket of products and services, many of which are not consumed by everyone, every year. Each worker as a consumer purchases a unique basket of goods and services over the course of a year, so technically, a personalized CPI comprising the prices of products and services actually consumed would provide a more accurate picture of changes to individual real incomes.
As the pictures below so clearly demonstrate, consumers who spend more of their incomes on products that are more likely to be imported get more buying power from the dollars they earn than do consumers who devote more of their budgets to products and services that are more difficult for foreigners to supply.
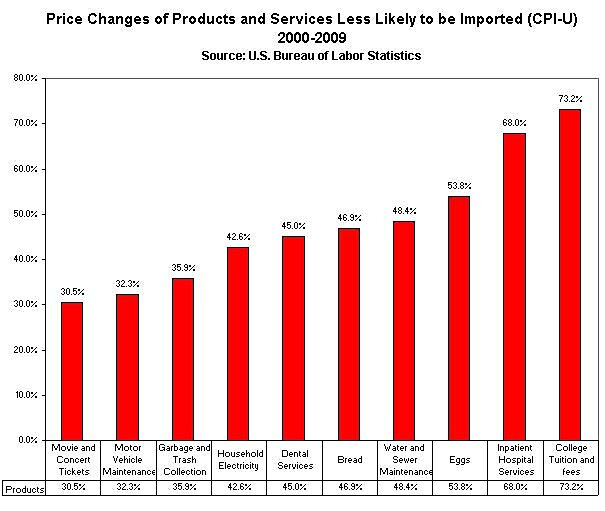
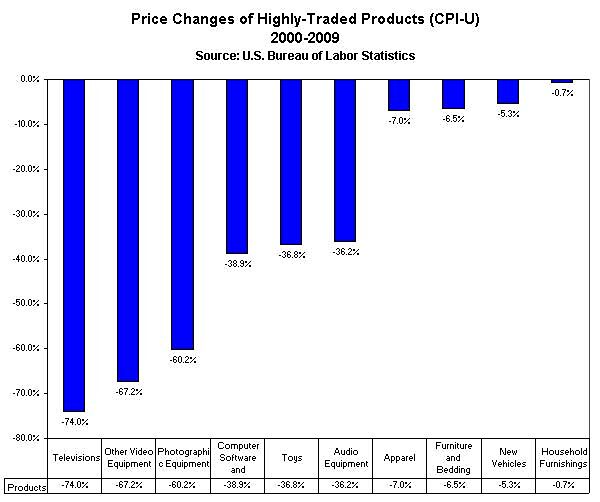
There is lots of competition from foreigner suppliers for the dollars we spend on televisions, photographic equipment, computer software, toys, clothing, furniture, automobiles, and furnishings, but virtually no such competition for our expenditures on movie tickets, auto repairs, dental services, trash collection, household electricity, medical services, and college tuition. And prices have responded accordingly.
Of course most individual consumption baskets include products from both of the charts above. The lesson here is that if we want to see prices kept in check, we should stop demonizing imports and stop throwing obstacles in their path. And we should do what we can to encourage more competition—both foreign and domestic—because more and taller blue bars, and fewer and shorter red bars, help raise real incomes.
* The CPI changes for “All Items” and all of the products listed in the subsequent charts were calculated from Bureau of Labor Statistics data by averaging the official CPI‑U figures for the years 2000 and 2001, and comparing that result to the average CPI‑U figures for the years 2008 and 2009. This was done to mitigate the effects of any anomalous price spikes or troughs in the first or last year of the decade.
