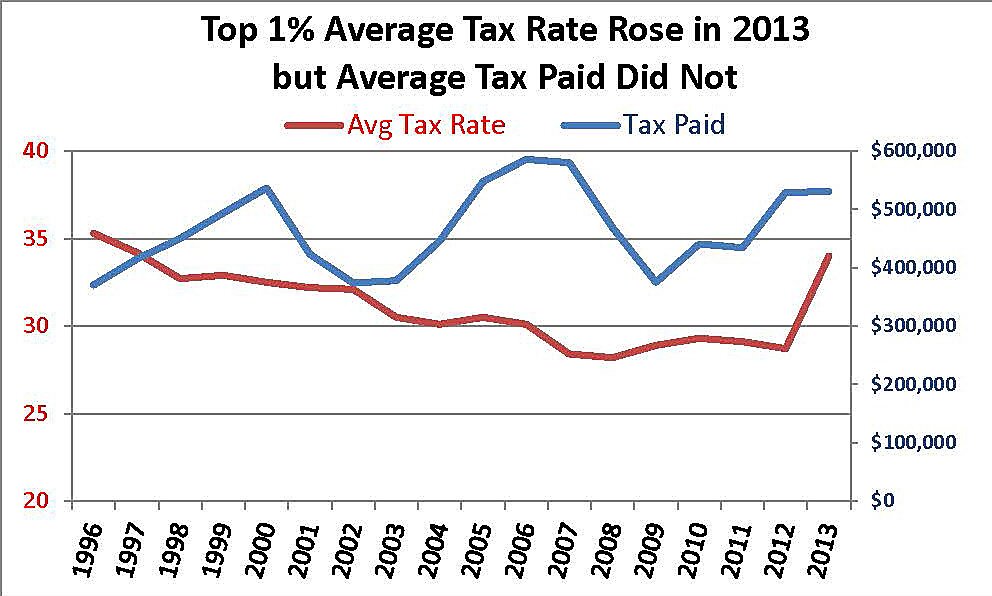
A timely new blog post from the Tax Foundation points out that, “taxes on the rich are much higher than they’ve been in recent years. Between 2008 and 2012, the top 1 percent of households paid an average tax rate of 28.8 percent. However, in 2013, this figure spiked to 34.0 percent, as a result of tax increases in the “fiscal cliff” deal and the Affordable Care Act”.
“Readers should check out the new CBO report,” the authors suggest, “and reflect for themselves about whether or not high-income Americans are now paying their fair share of taxes.”
The trouble is that the tax rate alone can’t tell us how much the Top 1% paid in taxes: To know how much taxes were paid by the Top 1% requires knowing how much income they reported to the IRS. The reason this matters is that there is ample evidence that the “elasticity of taxable income” is very high among top taxpayers, which simply means they find ways to report less income if marginal tax rates go up. This doesn’t require lawyers or loopholes: Avoid capital gains tax by not selling assets and/or shifting into exempt assets (housing up to $500k); avoid the dividend tax by holding tax-exempt bonds; defer personal tax on business income by retaining earnings within a C‑corporation; avoid punitive tax rates on second earners by becoming a one-earner household; retire early, etc.
Looking at the same thing from a different angle, the graph shows that average taxes actually paid by the Top 1% grew rapidly after the tax rate on capital gains was cut from 28 percent to 20 percent in 1997. Taxes paid by the Top 1% grew even more rapidly after 2003 when the tax rate on capital gains and dividends was further reduced to 15 percent and the top tax on salaries and unincorporated businesses was cut from 39.6 percent to 35 percent. If you want the rich to pay more taxes, cut their tax rates.
As it turns out, 2013 showed that we can’t just assume higher tax rates mean docile taxpayers will simply write bigger checks to the U.S. Treasury. On the contrary, when the average tax rate on the Top 1% increased by 18.4 percent in 2013, the amount of income reported by the Top 1% fell by 15.4 percent – from $1,856,000 in 2012 to $1,571,600. The net effect was almost a wash, in terms of taxes actually paid. According to the CBO, average federal taxes paid by the Top 1% were $530,128 in 2013 –virtually unchanged from $529,056 in 2012.
Presidential candidates Bernie Sanders and Hillary Clinton propose even more increases in top tax rates on income and capital gains (to 54.2 percent with Sanders, 43.6 percent with Clinton), ostensibly to finance their lavish government spending plans. But even a relatively small dose of this same poison failed to raise significant revenue from the Top 1% in 2013, partly because of the drag on the overall economy from reduced incomes and incentives.
