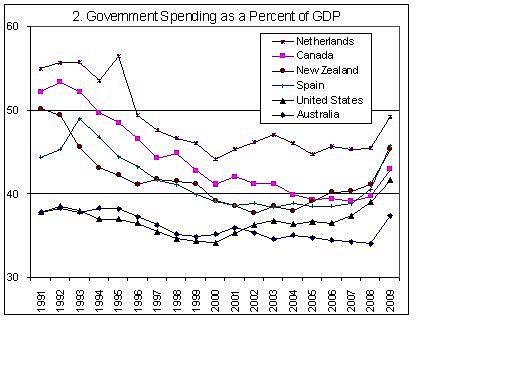
Federal, state, and local government spending will be 42 percent of U.S. gross domestic product in 2009, according to data from the Organization for Economic Cooperation and Development. That’s huge–more than 4 out of every 10 dollars of everything produced in America now gets channeled through governments.
How does that compare to other advanced nations? Chart 1 shows that total government spending in the United States is somewhat less than the average of the 30 industrial nations in the OECD, but that the U.S. advantage is shrinking. During the 1990s, the U.S. government size was about 10 percentage points smaller than the average OECD government size, but that gap has shrunk and is now only 5 percentage points.
Most of the erosion of America’s smaller government advantage occurred during the early Bush administration years. In the last two years, the recessions and expansionary fiscal actions have boosted the size of governments both here and abroad, as shown in the chart.That’s the bad news. The good news is that some advanced nations have substantially cut the sizes of their governments in recent decades, which illustrates that it can be done. Chart 2 shows total government spending as a share of GDP for the U.S. and for five OECD nations that have had relatively sound fiscal policies. Putting aside the recent recession-induced increases, Canada, New Zealand, and the Netherlands have chopped their governments by roughly 10 percentage points or more since the early 1990s.
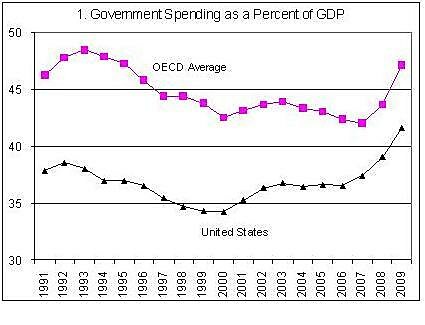
What’s the upshot for U.S. policy? Many Americans have been stunned at the rapid expansion in government spending in recent years. But international experience shows that we can stop that expansion and, indeed, reverse it. If Australian, Canadian, Dutch, New Zealand, and Spanish lawmakers can shrink the relative sizes of their governments, then we can to. We just need to elect policymakers who support that goal. That is a tall order, but entirely doable.