At a recent rally in El Paso, Texas, President Trump again claimed that that city had a high crime rate before a fence was built between it and Mexico in 2008 and 2009. Many people have pointed out that El Paso has long been a more peaceful city than others, before and after the border fence was built. This post adds just a few more visuals to hammer home the point made by others and an odd anomaly in homicides.
I constructed the figures using local police department crime data from the Uniform Crime Reports (UCR) database, focusing on departments that policed populations of between 500,000 to 1 million. That population size was appropriate as El Paso’s population was 683,577 in 2017. The local police departments variable identifies city police departments in the UCR, but it also includes several large urbanized counties in Maryland, Georgia, Virginia, North Carolina, and elsewhere. In total, 41 different cities and counties met the criteria, including El Paso. I further relied on the FBI population estimates to calculate the crime rates. Lastly, I set the base year of 2000 at 100, and compared the crime rates in El Paso over time with the average crime rates across the other 40 other jurisdictions.
These charts convinced me that I did not need to run any regressions nor was the story significantly than that which was already reported, with one exception. First, the consistent findings. Figure 1 shows the overall crime rate in El Paso versus the other 40 jurisdictions. The gray shaded area is when the El Paso border fence was under construction. Looks like crime continued to decline in El Paso and in the other cities after the wall was built at about the same rate as it declined prior the government’s construction of a border fence there.
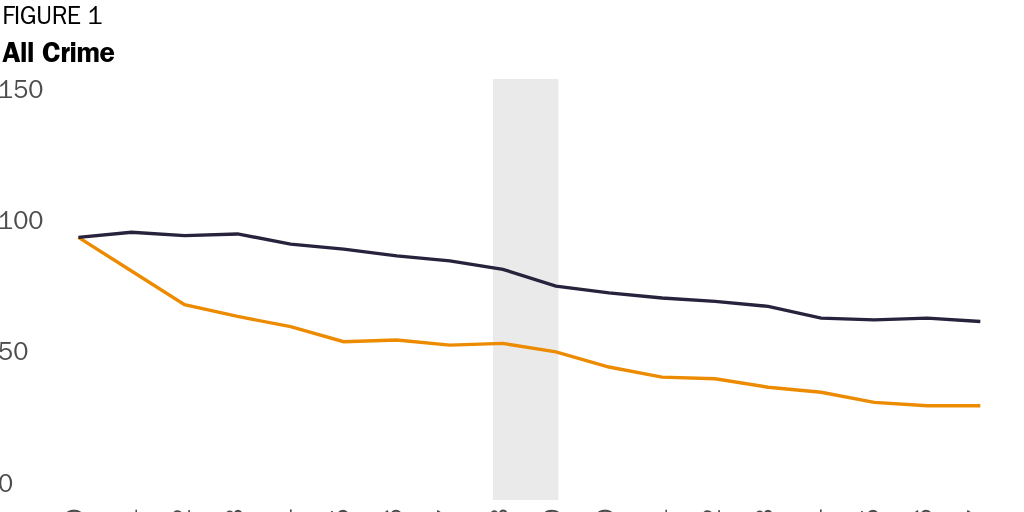
Figure 2 shows the violent crime rates in El Paso relative to the other jurisdictions, with more of a pre-fence dip in violent crime in El Paso relative to other cities, followed with a bit of a rise before construction began. The construction of the border fence there looks uneventful. Figure 3 shows property crime rates and it looks even less impressive than the first two figures.
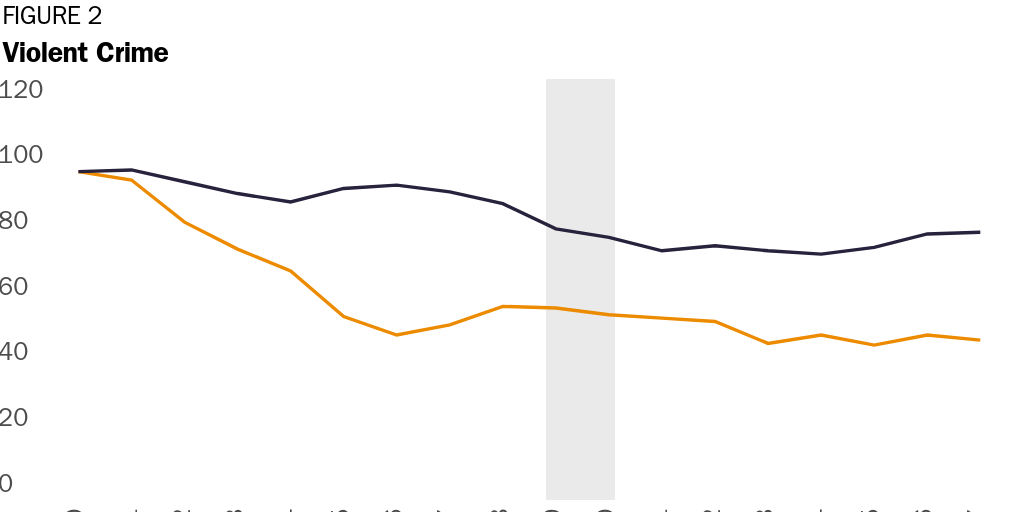
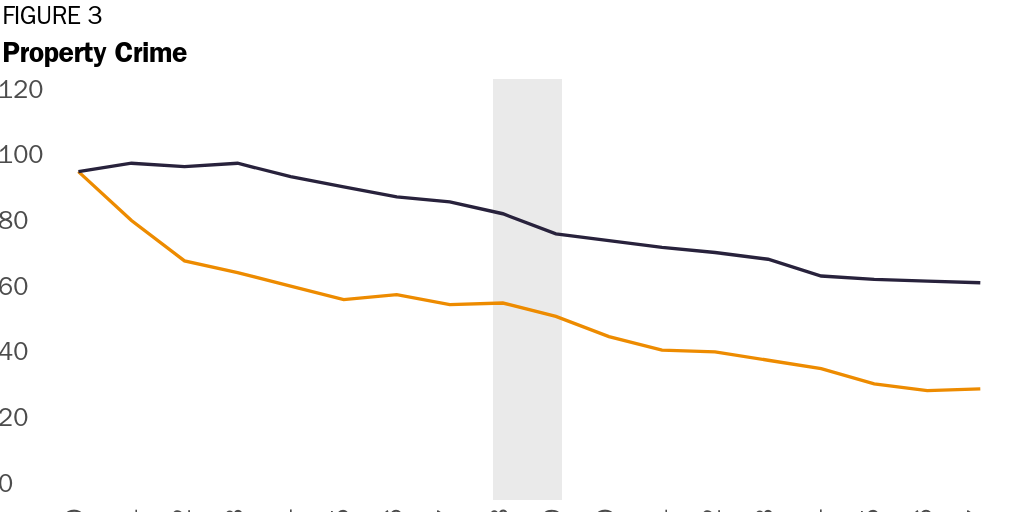
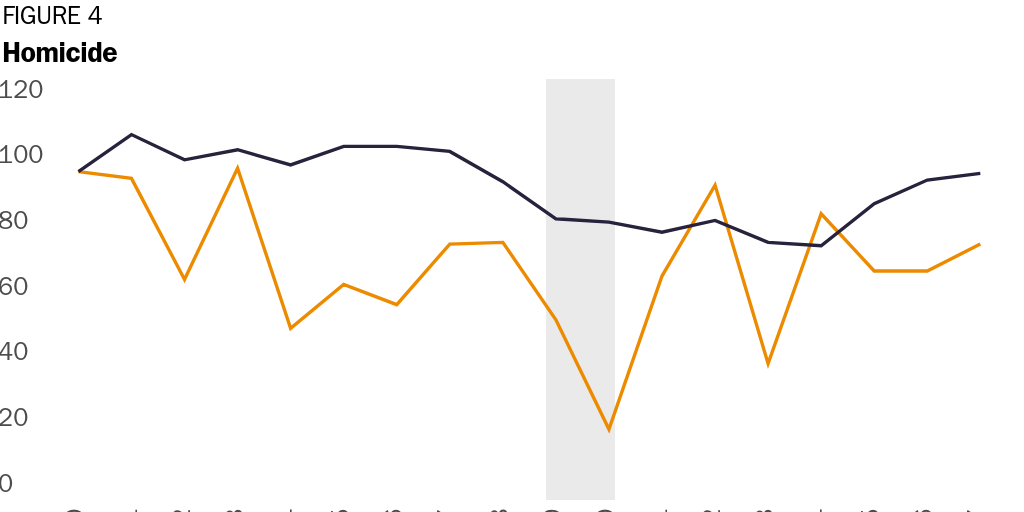
Figure 4 shows the homicide rate in El Paso versus the 40 comparison cities – and it spiked more than a year after the government constructed the fence between El Paso and Mexico. The homicide rate in El Paso was 2.8 per 100,000 in 2008 when fence construction began, fell to 1.9 in 2009 when fence construction, fell again to 0.8 in 2010, spiked to 2.4 in 2011, and climbed again to 3.4 in 2012 before coming back down. The big decline happened right after the fence was built, but the huge spike also occurred when the fence was fully constructed. Without a lot more econometrics, I’m unable to even provide hypotheses to explain the crash and spike in homicides in El Paso. Illegal immigration is probably not a factor as the number of apprehensions in El Paso crashed, partly because of the border fence and partly because of the end of mass illegal Mexican immigration. Homicide rates in San Diego and Tucson, two other border cities, do not show a similar pattern.
Regardless of the potential explanations for the spike in homicides shortly after the government completed the border fence in El Paso, President Trump’s story is even less true than has been reported by others – at least according to the empirical standards of this public debate. Please don’t take this post or what I wrote here as arguing that the border fence in El Paso caused the spike in homicides, as I see no evidence to support that claim and I have not carried out nearly enough statistical work on this issue to confidently state that.
