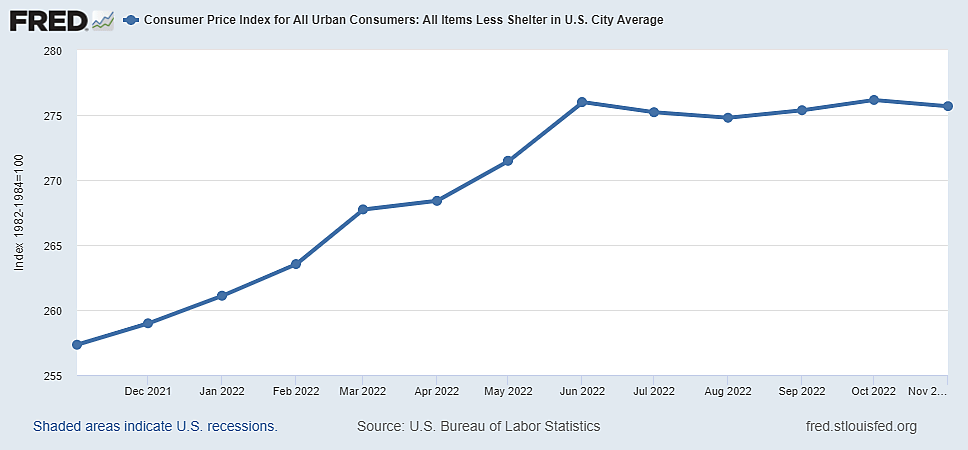
In October I wrote, “CPI Less Rent Was Zero for 3 Months; CPI Rent Is Wrong.”
Nobody appeared to find that interesting.
Now, CPI less rent has shown zero inflation for 5 months.
How long can zero remain uninteresting?
Some prices went up over the past five months and others went down, but the weighted average increase for everything in the average consumer’s shopping basket was nil once we properly exclude disingenuous and outdated estimates of shelter inflation.
The Federal Open Market Committee (FOMC) and Chairman Powell have acknowledged that Bureau of Labor Statistics surveys of rent and owner-equivalent rent estimates are extremely lagged. The FOMC knows that recent months of falling house prices and rents will show up as low housing inflation in next year’s numbers. In the meantime, recent shelter inflation measures (supposedly up again 0.7% last month) have been statistical rubbish.
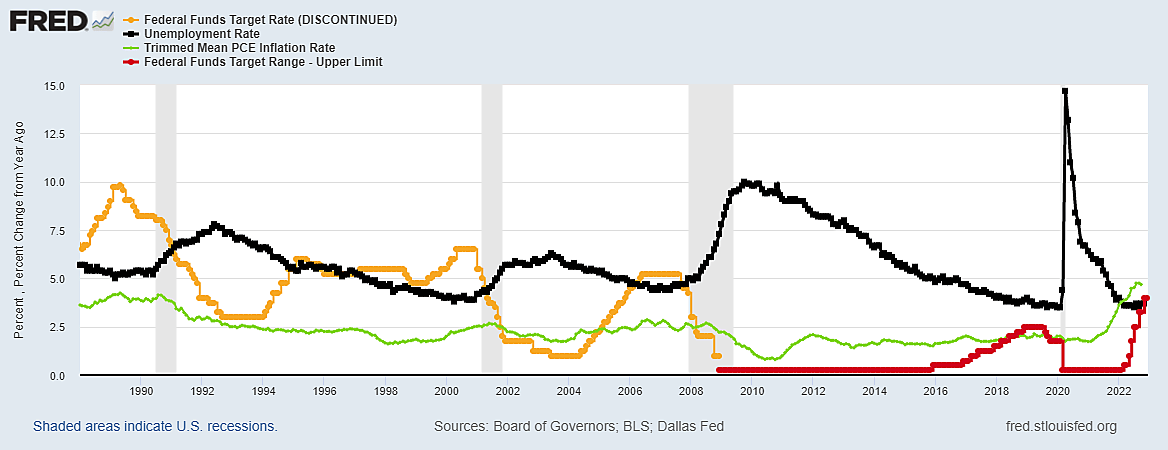
For more than a month, the interest rate on 3‑month Treasury bill rates has been higher than the yield on 10-year bonds – an “inverted yield curve” that always ends in recession, unless the fed funds and IOR rates are reduced before that happens. Yet the Federal Open Market Committee is said to be determined to push short-term rates a half-point higher by raising the interest rate the Fed pays on bank reserves (IOR) from 3.9% to 4.4% (in the guise of a symbolic maximum federal funds rate of 4.5%). The question is why?
The Federal Reserve Board’s Chairman Jerome Powell now faces the unenviable task of trying to explain why the Fed is trying to steepen the already perilous inversion of the yield curve despite very little inflation since June (aside from a statistical illusion in the way the BLS slowly collects and estimates from outdated rent data).
In an important November 30 talk at the Brookings Institution, Chairman Powell ended with his familiar tagline: “History cautions strongly against prematurely loosening policy.” The specific history he meant, his August 25 Jackson hole speech explained, is the period between the Arab oil crisis in 1974 and Iranian oil crisis in 1980:
“The successful Volcker disinflation in the early 1980s,” according to Chair Powell, “followed multiple failed attempts to lower inflation over the previous 15 years.” That had nothing to do with premature easing, and everything to with two infamous spikes in world oil prices. Inflation and the federal funds rate rose with soaring oil prices in the 1974 oil crisis, both came down a few years but then rose again with the 1980 crisis, and inflation came down much faster than fed funds again as oil prices did. Harsh hard landings during oil crises caution strongly against belatedly easing policy until recessions become unstoppable and severe.
A centerpiece of the Federal Reserve’s favorite institutional self-defense mechanisms has long been to rewrite the history of the 1970s as a contrast between “prematurely loosening” under Chairman Burns and “staying the course” under Chairman Volcker. That fable is entirely false, as I have documented here and here.
Volcker was, in fact, much quicker to cut rates in the 1980 and 1982 recessions than Burns was in 1975, and Volcker cut the funds rate more deeply (by 10 percentage points). Yet the useful mythology about “prematurely loosening in the seventies” (rather than 1980) still exerts mesmerizing influence on policymakers and their compliant media messengers.
All Fed chairmen have always cut rates in recessions, usually by 5–6 percentage points or more. The downside phase of Fed up-down rate cycles usually begins with tiny rate cuts a few months before unemployment has risen significantly. The fed funds rate often keeps falling long after the end of recession (see 2004 and 2015) and then the Fed launches another series of rate increases if the unemployment rate falls below some threshold defined by elastic Phillip Curve estimates about how high unemployment must be to tame inflation.
The last graph shows two “soft landings” praised by former Fed Vice Chairman Alan Blinder after 1984 and 1994 which can be compared with three hard ones. The red line is FOMC targets for the federal funds rate, the green line is the year-to-year change in real GDP (which was public knowledge when the time the Fed changed rate targets). It looks to me as if the Fed was targeting real economic growth per se rather than price inflation. The fed funds rate target rose and fell in reaction to the previous four quarters’ real GDP growth, but with a lag. The U.S. economy was so strong in the Reagan and Clinton years –growing by 4.4% a year from 1983 to 1989 and by 4.0% from 1994 to 2000– that it could handle temporary Fed excesses. The brief rate hike of 1984 was promptly followed by cutting the funds rate nearly five percentage points. The brief rate hike of 1994 was followed by cutting the funds rate nearly two points. Quickly pivoting to lower rates quickly also appears to have worked in 2018–19, although COVID lockdowns complicate a certain verdict.
The FOMC did trim interest rates timidly before the hard landings of 1991, 2001 and 2007-09, but always too little and too late. The fed funds rate was then deeply reduced during and long after these and other hard landings, setting the stage for a rebound of real growth, another cycle of rising rates, and another hard landing.
“We wouldn’t…try to crash the economy and then clean up afterwards,” Chairman Powell recently remarked. “I wouldn’t take that approach at all.” Yet that is, in fact, what every other Fed Chair has done during predictable yield-curve-inversion recessions.
Aside from rare soft landings when the FOMC promptly pivoted toward cutting rates, “crash and cleanup” is an apt description of what happened after every other Fed Chair pushed the federal funds rate above the bond yield ever since 1955 when the federal funds rate was revived as a policy tool (after suffering some disrepute in 1929–33).


