TRAC Immigration, a project of Syracuse University, published a report this week, showing that 81 percent of recently released families apprehended at the border showed up for all of their hearings. Some immigration court locations did much better than others in obtaining compliance from immigrant families. San Francisco’s court had almost zero no-shows, while two and five skipped out in Atlanta.
TRAC’s report hypothesized that it was possible that “the lowered appearance rates in some courts arose from particular deficiencies in the recording, scheduling or notification systems there.” While this could be, there is no way to test for such variation. Another strong hypothesis, suggested by Aaron Reichlin-Melnik of American Immigration Council, is that immigrants are much more likely to fail to appear in courts where they have a lower probability of receiving asylum.
Fortunately, TRAC also reports asylum grant rates by immigration court, allowing us to test this.
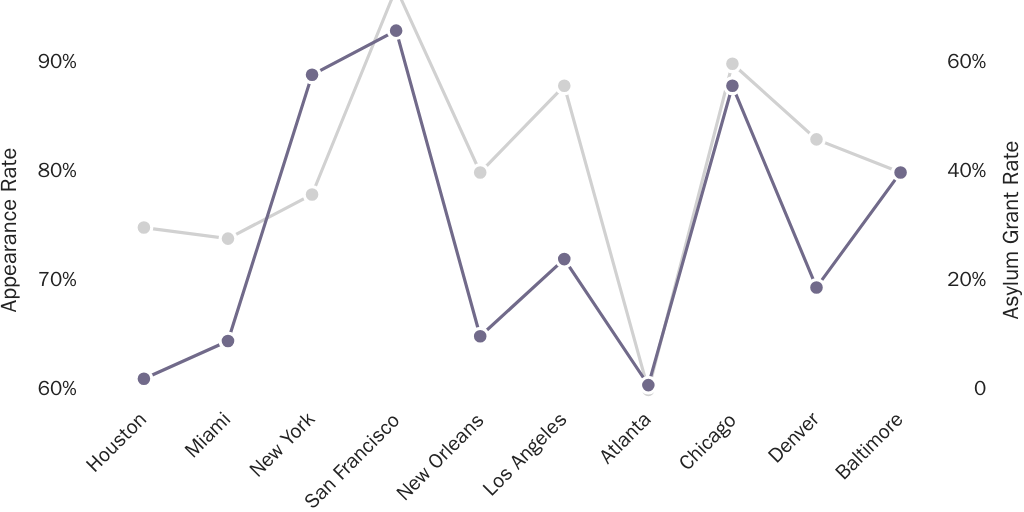
Figure 1 shows the relationship between asylum grant rates in FY 2019 and family appearance rates in the ten immigration courts that received the most family docket cases (in order of the courts with most cases). These ten court were initially designated to track “family unit” cases in November 2018, and while this practice has expanded to several other courts, 87 percent of the family cases tracked by the government are still in these ten courts.
The five courts with the highest appearance rates had asylum grant rates on average 55 percent higher than the five courts with the lowest appearance rates (37 percent to 23 percent). The five most successful courts had 89 percent of their immigrant families appear at all hearings compared to 75 percent at the other five courts.
The asylum grant rate in 2019 predicted a very significant portion of the variance in appearance rates between courts—42 percent to be precise—that year, and a 10 percentage point increase in the asylum grant rate in a court is associated with almost a 3 percentage point increase in the appearance rate for that court. There are other ways to measure the asylum grant rate. The immigration courts include asylum cases that were closed without a decision being made on the merits. But using that metric doesn’t change the association.
Higher failure to appear rates do not explain the higher denial rates, as just 1.4 percent of asylum denials are a result of a failure of the immigrant to appear. People who skip almost always do so before they officially file for asylum. It could be that immigrants who go to certain courts like Atlanta have worse asylum claims to begin with, but as TRAC notes, “there seems little reason for families with different strengths of asylum claims to migrate to some parts of the country and avoid others.”
Ultimately, the identity of the judge seems like the most important factor in winning asylum. The Government Accountability Office in 2016 found that even controlling for other relevant factors, “the defensive asylum grant would vary by 57 percentage points if different immigration judges heard the case of a representative applicant with the same average characteristics we measured.” It would be very useful if TRAC published data on the appearance rates by judge to determine if it’s the location or the judge that matters the most.
Obviously, because we only have data for a few courts in 1 year, it is impossible to nail down this relationship with certainty, but it appears that if every court had the same asylum grant rate as San Francisco (68 percent), the appearance rate for families would have increased to 90 percent. It may seem obvious that the likelihood of success in court makes people more likely to follow the legal process. But many people’s impression is that every asylum applicant has no case, so they have no reason to show up. That’s false, but unfortunately, some courts are turning this theory into a self-fulling prophecy.
