In honor of April 22, consider this picture:
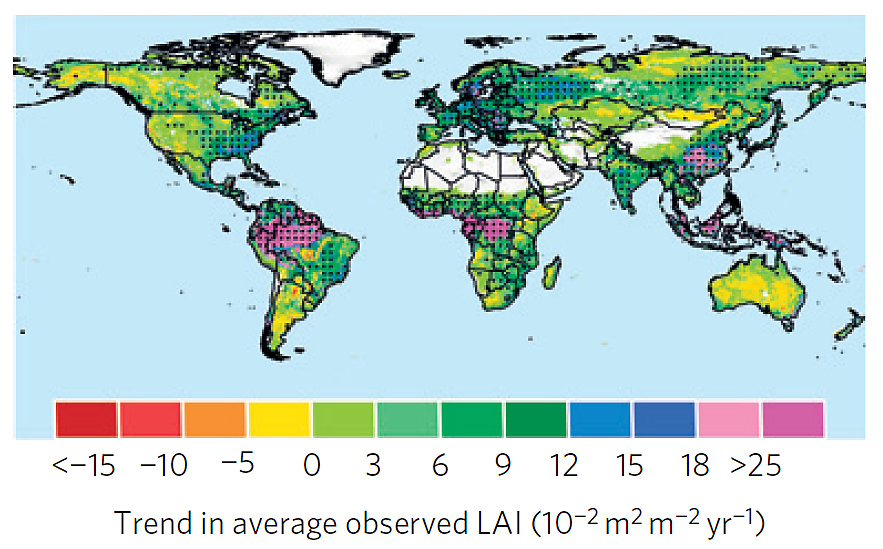
It’s taken from Zhu et al’s 2016 paper, “Greening of the Earth and its Drivers.” “Leaf Area Index” is a measure of the density of vegetation cover. It’s positive over most of the planet, and especially so in the purple-shaded regions, which are mainly the tropical rainforest, the most diverse and revered of our ecosystems.
Only 4% of the surface shows the opposite, or a significant “browning.” The causes of the planetary greening? In a word, “us.” According to the Zhu et al., 91% of the greening is attributable to human activity. Perhaps it’s best to simply quote from the paper:
Factorial simulations with multiple global ecosystem models suggest that CO2 fertilization effects explain 70% of the observed greening trend, followed by nitrogen deposition (9%), climate change (8%) and land cover change (LCC) (4%). CO2 fertilization effects explain most of the greening trends in the tropics, whereas climate change resulted in greening of the high latitudes and the Tibetan Plateau.
Again, Happy Earth Day!
