The alleged attacker in Tuesday’s Halloween terrorist attack in New York City that murdered eight people and injured 12 was Sayfullo Habibullaevic Saipov, an immigrant from Uzbekistan. Saipov entered the United States in 2010 on a green card he won through the Diversity Immigrant Visa Program (also known as the diversity visa or green card lottery). Many commenters on the attack, including President Trump, have partially blamed the diversity visa for this terrorist attack. This post will explain some of the basics of the diversity visa, the countries-of-origin for those who enter on it, their incarceration rates, and terrorism risks.
The Diversity Visa
Congress created the diversity visa as part of the Immigration Act of 1990, in order to provide lawful immigration opportunities for Irish immigrants who were fleeing an economic crisis in their home country. Then-Congressman Chuck Schumer (D‑NY) was important in pushing for the idea to be included in the bi-partisan 1990 Immigration Act, which Congress passed by huge majorities and President George H.W. Bush signed.
Fifty thousand green cards are awarded through the diversity lottery each year, which is run in early May. Principal applicants for the diversity visa must have at least a high school education, two years of work experience, and not be inadmissible under U.S. immigration law in order to receive a diversity visa. The principal applicants may bring their spouse and minor unmarried children with them, but they do not count against the 50,000 cap. Those who enter the running for the diversity visa lottery may only be from certain countries that sent fewer than 50,000 non-diversity visa immigrants to the United States in the five years prior to the lottery.
Countries of Origin for the Diversity Visa
In 2015, about 9.4 million people entered the lottery for those 50,000 green cards. They had about five million minor unmarried children and spouses. Citizens from countries other than Bangladesh, Brazil, Canada, China (mainland-born), Colombia, Dominican Republic, El Salvador, Haiti, India, Jamaica, Mexico, Nigeria, Pakistan, Peru, Philippines, South Korea, United Kingdom (except Northern Ireland) and its dependent territories, and Vietnam were eligible to apply for the 2018 diversity visa.
About one million people gained lawful permanent residency status through diversity visas from 1993 through 2015 (Table 1 at end of post). Saipov is from Uzbekistan, which has sent 29,665 immigrants on the diversity visa, which accounts for about 43 percent of the total number of green cards issued to Uzbeks since 1993. Only Algerian, Bulgarian, and Albanian immigrants were more likely to enter on a diversity visa. Ethiopia, Nigeria, Egypt, Ukraine, Albania, Bangladesh, Ghana, Bulgaria, and Morocco all sent more diversity visa immigrants to the United States than Uzbekistan.
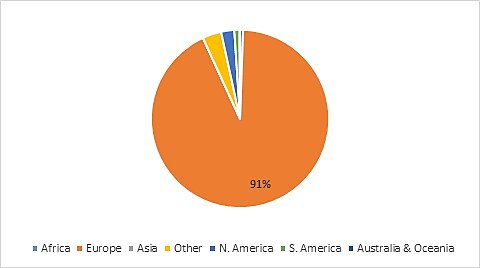
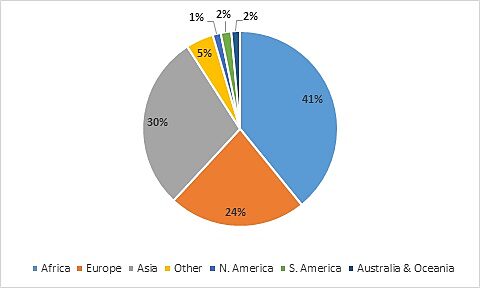
Like other immigration liberalizations that Congress intended to apply to only Europeans, the composition of the diversity visa quickly morphed when it contacted reality. Europeans won a full 91 percent of all diversity visas in 1993, the first year the program was in operation (Figure 1). In 2015, only 24 percent of diversity immigrants came from Europe while 30 percent came from Asia and 41 percent from Africa (Figure 2). As for the Irish, only 12,221 won the lottery in 1993 while 45 won in 2015.
Figure 1
Diversity Visa Admissions by Continent of Origin, 1993
Sources: State Department and Department of Homeland Security.
Figure 2
Diversity Visa Admissions by Continent of Origin, 2015
Sources: State Department and Department of Homeland Security.
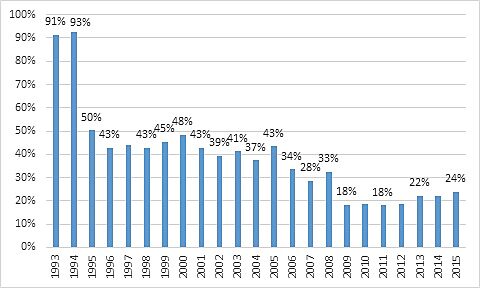
The share of diversity visas issued to Europeans fell precipitously after 1994 when the Irish economy started to recover (Figure 3).
Figure 3
European Share of Diversity Visa
Sources: State Department and Department of Homeland Security.
Terrorism
Many immigrants to the United States initially enter on one type of visa and then adjust their status to a green card or lawful permanent residency. A foreigner who is lawfully present on U.S. soil can apply for the diversity visa if they are otherwise eligible. That is exactly what the wife of Egyptian-born Hesham Mohamed Hedayet did. He originally entered on a tourist visa, later applied for asylum, and only gained a green card when his wife won the diversity visa. Hedayet murdered two and injured four in a terrorist attack at Los Angeles International Airport in 2002. If he intended to carry out an attack prior to entering the United States, the diversity visa did not give him the opportunity because he was already here. Assuming he intended to carry out an attack before arriving, and there is no evidence of that as he was here for a decade before he murdered two people, the diversity visa was not the potential weak link in the vetting system.
Syed Harris Ahmed from Pakistan and Abdurasul Juraboev from Uzbekistan entered with diversity visas and were also convicted of planning terrorist attacks on U.S. soil. A handful of immigrants who had diversity visas at one point were convicted of material support for terrorism or other offenses aimed at supporting foreign terrorists. Hedayet is the only deadly terrorist who had a diversity visa at some point in his immigration history, although he did not enter on it – he murdered 2 people, or about 0.07 percent of all those killed by a foreign-born terrorist in an attack on U.S. soil from 1975-Halloween 2017.
The diversity visa is not an efficient way for terrorists to enter the country. As mentioned above, about 9.4 million people entered the lottery for 50,000 green cards in 2015. If a terrorist lives in a country whose nationals can apply, he or she would have had a 1 in 188 chance of winning the lottery in 2015. The terrorist would then have to get through the normal procedures applied to every green card applicant. Those are not attractive odds for a terrorist intent on attacking U.S. soil. Furthermore, there is no indication that Saipov intended to commit a terrorist attack before coming to the United States. Officials said that Saipov began planning his attack a year ago and then decided to use a truck two months ago, long after he entered in 2010.
The diversity visa is not a wise choice for foreign-born terrorists who concoct their plans overseas. The small number of people murdered by foreign-born terrorists who actually entered on the visa, eight out of 3,037 since 1975, shows just how rarely it is used for such purposes. Even then, betting vetting would have stopped Saipov as his terrorism plans were recent. Based entirely on the New York Halloween terrorist attack, about 177,394 diversity visas have been granted for each person murdered in a terrorist attack on U.S. soil by someone who entered on such a visa.
Crime
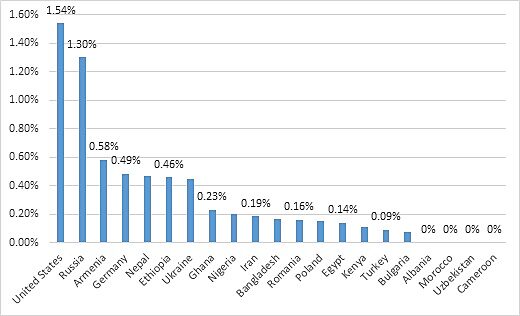
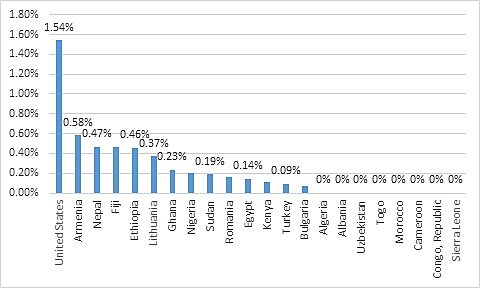
Public safety also includes crime. The American Community Survey reports the number of people incarcerated by their country of birth but not the particular visa they entered on. The 2015 incarceration rates for immigrants from the 20 countries that sent the greatest number of diversity immigrants from 1993 to 2015 are all lower than the incarceration rate for native-born Americans (Figure 4). The number of Uzbeks incarcerated is so small that it is statistically indistinguishable from zero. The 2015 incarceration rate for immigrants from these 20 countries is 0.28 percent – about one-fifth of the native incarceration rate.
Figure 4
Incarceration Rates by Country of Birth, Ages 18–54.
Source: Author’s analysis of the 2015 1‑year American Community Survey data. Special thanks to Michelangelo Landgrave for assembling these numbers.
Immigrants from the top 20 diversity visa dominant sending countries are less likely to be incarcerated than native-born Americans (Figure 5). All of these 20 countries together have an incarceration rate of 0.20 percent – about one-eighth that of native-born Americans. Figure 5 shows the 2015 incarceration rates for immigrants from the top 20 countries that sent the highest percentage of diversity visa immigrants relative to all who earned a green card. Benin and the Democratic Republic of the Congo sent a higher proportion of diversity visa immigrants, relative to all immigrants they sent, than two of the countries in Figure 5, but their U.S. populations are so small that they aren’t counted in the American Community Survey. I filled that gap by choosing countries with the next highest percentage of diversity immigrants relative to all immigrants.
Figure 5
Incarceration Rates by Country of Birth for Diversity Visa Dominant Countries, Ages 18–54
Source: Author’s analysis of the 2015 1‑year American Community Survey data. Special thanks to Michelangelo Landgrave for assembling these numbers.
Conclusion
The diversity visa is a relatively small green card category that has allowed in about a million legal immigrant principals since 1993, or about 5 percent of the total. As far as we know, immigrants who entered on the diversity visa are responsible for committing one terrorist attack on U.S. soil that murdered eight people. Foreign-born people from countries that have sent many diversity visa immigrants to the United States have lower incarceration rates than native-born Americans. Calls to end the diversity visa based on a single deadly terrorist attack are premature.
Table 1
Diversity Visa Admissions by Country of Origin, 1993–2015
| All Green Cards | Diversity | Percent of Immigrants on Diversity | Percent of Diversity Immigrants Relative to All Diversity Visas | |
| Algeria | 21,728 | 11,175 | 51.43% | 1.18% |
| Bulgaria | 70,332 | 33,898 | 48.20% | 3.59% |
| Albania | 90,121 | 42,419 | 47.07% | 4.50% |
| Uzbekistan | 68,364 | 29,665 | 43.39% | 3.15% |
| Togo | 22,931 | 9,857 | 42.99% | 1.05% |
| Lithuania | 26,674 | 11,107 | 41.64% | 1.18% |
| Benin | 4,774 | 1,954 | 40.93% | 0.21% |
| Morocco | 76,112 | 30,398 | 39.94% | 3.22% |
| Cameroon | 47,951 | 16,297 | 33.99% | 1.73% |
| Tajikistan | 4,867 | 1,644 | 33.78% | 0.17% |
| Congo, Democratic Republic | 26,873 | 8,852 | 32.94% | 0.94% |
| Egypt | 148,609 | 48,178 | 32.42% | 5.11% |
| Ethiopia | 200,417 | 60,194 | 30.03% | 6.38% |
| Nepal | 94,466 | 28,025 | 29.67% | 2.97% |
| Turkmenistan | 3,171 | 915 | 28.86% | 0.10% |
| Congo, Republic | 14,611 | 4,026 | 27.55% | 0.43% |
| Armenia | 52,321 | 14,297 | 27.33% | 1.52% |
| Kenya | 103,303 | 27,094 | 26.23% | 2.87% |
| Ghana | 132,664 | 34,755 | 26.20% | 3.69% |
| Nigeria | 214,372 | 56,049 | 26.15% | 5.94% |
| Romania | 100,436 | 25,845 | 25.73% | 2.74% |
| Turkey | 77,644 | 19,148 | 24.66% | 2.03% |
| Fiji | 26,759 | 6,475 | 24.20% | 0.69% |
| Sierra Leone | 38,890 | 8,969 | 23.06% | 0.95% |
| Belarus | 45,388 | 10,314 | 22.72% | 1.09% |
| Georgia | 20,966 | 4,583 | 21.86% | 0.49% |
| Kyrgyzstan | 9,643 | 2,099 | 21.77% | 0.22% |
| Niger | 4,845 | 994 | 20.52% | 0.11% |
| Sudan | 53,311 | 10,695 | 20.06% | 1.13% |
| Burkina Faso | 4,727 | 917 | 19.40% | 0.10% |
| Moldova | 37,510 | 7,236 | 19.29% | 0.77% |
| Ukraine | 253,865 | 47,554 | 18.73% | 5.04% |
| Sri Lanka | 32,408 | 6,061 | 18.70% | 0.64% |
| Liberia | 73,123 | 13,377 | 18.29% | 1.42% |
| Bangladesh | 217,098 | 38,833 | 17.89% | 4.12% |
| Macedonia | 17,042 | 2,842 | 16.68% | 0.30% |
| Mongolia | 7,640 | 1,232 | 16.13% | 0.13% |
| Azerbaijan | 19,451 | 3,077 | 15.82% | 0.33% |
| Cote d’Ivoire | 20,631 | 3,013 | 14.60% | 0.32% |
| Kazakhstan | 27,516 | 4,013 | 14.58% | 0.43% |
| Madagascar | 1,124 | 161 | 14.32% | 0.02% |
| Eritrea | 23,113 | 3,143 | 13.60% | 0.33% |
| Guinea-Bissau | 1,580 | 211 | 13.35% | 0.02% |
| Switzerland | 16,845 | 2,169 | 12.88% | 0.23% |
| Kosovo | 4,218 | 538 | 12.75% | 0.06% |
| Libya | 5,133 | 632 | 12.31% | 0.07% |
| Latvia | 9,532 | 1,131 | 11.87% | 0.12% |
| Serbia | 4,255 | 488 | 11.47% | 0.05% |
| Uganda | 17,215 | 1,969 | 11.44% | 0.21% |
| Rwanda | 6,752 | 762 | 11.29% | 0.08% |
| Ireland | 29,032 | 3,250 | 11.19% | 0.34% |
| Saudi Arabia | 25,323 | 2,831 | 11.18% | 0.30% |
| Tunisia | 7,368 | 822 | 11.16% | 0.09% |
| Poland | 202,289 | 22,484 | 11.11% | 2.38% |
| Germany | 138,880 | 15,271 | 11.00% | 1.62% |
| Czechoslovakia (former) | 12,752 | 1,327 | 10.41% | 0.14% |
| Qatar | 2,592 | 267 | 10.30% | 0.03% |
| Mauritius | 1,428 | 147 | 10.29% | 0.02% |
| South Africa | 57,953 | 5,761 | 9.94% | 0.61% |
| Guinea | 15,483 | 1,537 | 9.93% | 0.16% |
| New Zealand | 18,383 | 1,797 | 9.78% | 0.19% |
| Russia | 256,770 | 25,041 | 9.75% | 2.66% |
| Papua New Guinea | 418 | 40 | 9.57% | 0.00% |
| Hungary | 22,723 | 2,171 | 9.55% | 0.23% |
| Soviet Union (former) | 195,502 | 18,299 | 9.36% | 1.94% |
| Gabon | 1,684 | 156 | 9.26% | 0.02% |
| Iran | 232,402 | 21,057 | 9.06% | 2.23% |
| Malawi | 2,064 | 186 | 9.01% | 0.02% |
| Tanzania | 16,922 | 1,524 | 9.01% | 0.16% |
| Senegal | 17,942 | 1,578 | 8.80% | 0.17% |
| Oman | 1,378 | 121 | 8.78% | 0.01% |
| United Arab Emirates | 13,215 | 1,155 | 8.74% | 0.12% |
| Australia | 48,126 | 4,167 | 8.66% | 0.44% |
| Austria | 8,784 | 758 | 8.63% | 0.08% |
| Estonia | 4,847 | 403 | 8.31% | 0.04% |
| Czech Republic | 6,402 | 517 | 8.08% | 0.05% |
| Greece | 20,343 | 1,612 | 7.92% | 0.17% |
| Iceland | 2,005 | 152 | 7.58% | 0.02% |
| Botswana | 791 | 59 | 7.46% | 0.01% |
| Chad | 1,405 | 103 | 7.33% | 0.01% |
| Zambia | 8,201 | 594 | 7.24% | 0.06% |
| Finland | 7,022 | 498 | 7.09% | 0.05% |
| Sweden | 22,971 | 1,622 | 7.06% | 0.17% |
| Djibouti | 1,190 | 82 | 6.89% | 0.01% |
| Zimbabwe | 13,314 | 893 | 6.71% | 0.09% |
| France | 74,745 | 4,993 | 6.68% | 0.53% |
| Slovakia | 3,757 | 247 | 6.57% | 0.03% |
| Indonesia | 50,330 | 3,164 | 6.29% | 0.34% |
| Italy | 52,046 | 3,197 | 6.14% | 0.34% |
| Curacao | 49 | 3 | 6.12% | 0.00% |
| Cyprus | 2,532 | 154 | 6.08% | 0.02% |
| Belgium | 11,467 | 660 | 5.76% | 0.07% |
| Mali | 6,722 | 365 | 5.43% | 0.04% |
| Netherlands | 25,919 | 1,396 | 5.39% | 0.15% |
| Tonga | 6,040 | 286 | 4.74% | 0.03% |
| Japan | 133,350 | 5,749 | 4.31% | 0.61% |
| Burundi | 5,842 | 244 | 4.18% | 0.03% |
| Spain | 34,765 | 1,439 | 4.14% | 0.15% |
| Kuwait | 20,340 | 831 | 4.09% | 0.09% |
| Burma | 121,428 | 4,865 | 4.01% | 0.52% |
| Denmark | 9,771 | 387 | 3.96% | 0.04% |
| Angola | 2,545 | 100 | 3.93% | 0.01% |
| Namibia | 872 | 34 | 3.90% | 0.00% |
| Croatia | 17,749 | 679 | 3.83% | 0.07% |
| Macau | 3,470 | 128 | 3.69% | 0.01% |
| Palau | 136 | 5 | 3.68% | 0.00% |
| Israel | 79,216 | 2,902 | 3.66% | 0.31% |
| Cambodia | 55,809 | 2,026 | 3.63% | 0.21% |
| Venezuela | 147,742 | 5,337 | 3.61% | 0.57% |
| Norway | 6,651 | 226 | 3.40% | 0.02% |
| Peru | 257,629 | 8,650 | 3.36% | 0.92% |
| Pakistan | 304,020 | 10,179 | 3.35% | 1.08% |
| Luxembourg | 471 | 15 | 3.18% | 0.00% |
| Slovenia | 1,605 | 48 | 2.99% | 0.01% |
| Taiwan | 161,568 | 4,639 | 2.87% | 0.49% |
| Montenegro | 1,394 | 40 | 2.87% | 0.00% |
| Portugal | 23,851 | 679 | 2.85% | 0.07% |
| Yemen | 49,556 | 1,358 | 2.74% | 0.14% |
| Monaco | 78 | 2 | 2.56% | 0.00% |
| Singapore | 14,626 | 370 | 2.53% | 0.04% |
| Lesotho | 251 | 6 | 2.39% | 0.00% |
| Somalia | 99,780 | 2,342 | 2.35% | 0.25% |
| Bahrain | 1,954 | 45 | 2.30% | 0.00% |
| Malta | 1,001 | 23 | 2.30% | 0.00% |
| Hong Kong | 83,306 | 1,889 | 2.27% | 0.20% |
| Malaysia | 39,194 | 810 | 2.07% | 0.09% |
| Seychelles | 195 | 4 | 2.05% | 0.00% |
| Unknown | 28,065 | 535 | 1.91% | 0.06% |
| Bolivia | 40,859 | 783 | 1.92% | 0.08% |
| Argentina | 81,114 | 1,521 | 1.88% | 0.16% |
| Mozambique | 1,112 | 20 | 1.80% | 0.00% |
| Aruba | 668 | 11 | 1.65% | 0.00% |
| Brunei | 429 | 7 | 1.63% | 0.00% |
| Gambia | 10,282 | 167 | 1.62% | 0.02% |
| Syria | 54,920 | 871 | 1.59% | 0.09% |
| Swaziland | 318 | 5 | 1.57% | 0.00% |
| Jordan | 73,909 | 1,125 | 1.52% | 0.12% |
| Equatorial Guinea | 211 | 3 | 1.42% | 0.00% |
| Mauritania | 6,089 | 85 | 1.40% | 0.01% |
| Afghanistan | 52,579 | 732 | 1.39% | 0.08% |
| Lebanon | 72,017 | 992 | 1.38% | 0.11% |
| Paraguay | 7,584 | 94 | 1.24% | 0.01% |
| United Kingdom | 234,161 | 2,866 | 1.22% | 0.30% |
| Cuba | 630,056 | 7,571 | 1.20% | 0.80% |
| Brazil | 205,681 | 2,446 | 1.19% | 0.26% |
| Ecuador | 204,339 | 2,372 | 1.16% | 0.25% |
| Central African Republic | 1,335 | 15 | 1.12% | 0.00% |
| Trinidad and Tobago | 85,419 | 953 | 1.12% | 0.10% |
| South Sudan | 277 | 3 | 1.08% | 0.00% |
| Suriname | 3,705 | 37 | 1.00% | 0.00% |
| Bahamas | 7,664 | 76 | 0.99% | 0.01% |
| Chile | 36,196 | 343 | 0.95% | 0.04% |
| Cape Verde | 26,687 | 250 | 0.94% | 0.03% |
| Thailand | 127,313 | 1,004 | 0.79% | 0.11% |
| Canada | 298,671 | 2,316 | 0.78% | 0.25% |
| Uruguay | 18,691 | 128 | 0.68% | 0.01% |
| Bosnia-Herzegovina | 121,026 | 801 | 0.66% | 0.08% |
| United States | 3,193 | 20 | 0.63% | 0.00% |
| Costa Rica | 37,479 | 231 | 0.62% | 0.02% |
| Barbados | 13,235 | 81 | 0.61% | 0.01% |
| Samoa | 3,753 | 22 | 0.59% | 0.00% |
| Panama | 33,178 | 192 | 0.58% | 0.02% |
| Dominica | 8,194 | 42 | 0.51% | 0.00% |
| Iraq | 174,316 | 805 | 0.46% | 0.09% |
| Grenada | 13,818 | 56 | 0.41% | 0.01% |
| Belize | 16,526 | 66 | 0.40% | 0.01% |
| Saint Lucia | 9,957 | 38 | 0.38% | 0.00% |
| Saint Vincent and the Grenadines | 6,046 | 20 | 0.33% | 0.00% |
| Nicaragua | 131,175 | 432 | 0.33% | 0.05% |
| Honduras | 135,484 | 435 | 0.32% | 0.05% |
| Guyana | 135,606 | 411 | 0.30% | 0.04% |
| French Polynesia | 337 | 1 | 0.30% | 0.00% |
| Antigua-Barbuda | 7,117 | 21 | 0.30% | 0.00% |
| British Virgin Islands | 878 | 2 | 0.23% | 0.00% |
| Saint Kitts-Nevis | 3,564 | 8 | 0.22% | 0.00% |
| Anguilla | 463 | 1 | 0.22% | 0.00% |
| Guatemala | 255,110 | 437 | 0.17% | 0.05% |
| Laos | 28,649 | 36 | 0.13% | 0.00% |
| India | 1,198,749 | 1,421 | 0.12% | 0.15% |
| Bermuda | 1,717 | 2 | 0.12% | 0.00% |
| Haiti | 396,924 | 292 | 0.07% | 0.03% |
| Bhutan | 49,881 | 34 | 0.07% | 0.00% |
| China, People’s Republic | 1,206,575 | 793 | 0.07% | 0.08% |
| Colombia | 414,973 | 248 | 0.06% | 0.03% |
| Korea, South | 152,483 | 68 | 0.04% | 0.01% |
| Dominican Republic | 648,938 | 168 | 0.03% | 0.02% |
| Philippines | 1,074,811 | 162 | 0.02% | 0.02% |
| Jamaica | 359,859 | 53 | 0.01% | 0.01% |
| Vietnam | 600,992 | 38 | 0.01% | 0.00% |
| Mexico | 3,175,771 | 183 | 0.01% | 0.02% |
| El Salvador | 432,535 | 20 | 0.00% | 0.00% |
| All other countries1 | 73 | 0 | 0.00% | 0.00% |
| Cayman Islands | 704 | 0 | 0.00% | 0.00% |
| Korea, North | 432 | 0 | 0.00% | 0.00% |
| Marshall Islands | 586 | 0 | 0.00% | 0.00% |
| Montserrat | 834 | 0 | 0.00% | 0.00% |
| Netherlands Antilles (former) | 67 | 0 | 0.00% | 0.00% |
| Serbia and Montenegro (former) | 232 | 0 | 0.00% | 0.00% |
| Sint Maarten | 90 | 0 | 0.00% | 0.00% |
| Turks and Caicos Islands | 38 | 0 | 0.00% | 0.00% |
| Total | 19,101,716 | 943,049 |
Sources: State Department and Department of Homeland Security.
