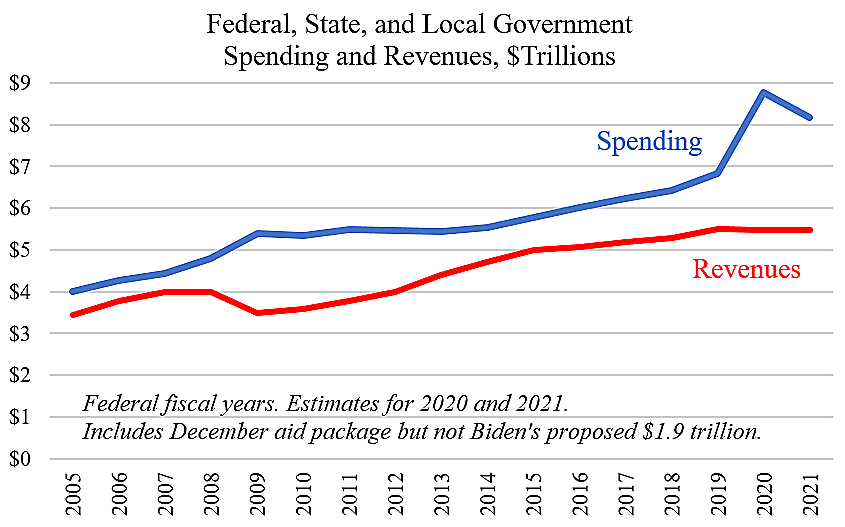
President Biden’s push to spend another $1.9 trillion on economic relief is surreal given that government budgets are vastly ballooned already. Total federal, state, and local government spending soared from $6.8 trillion in 2019 to $8.8 trillion in 2020. That is $68,000 in government spending for every household in the nation.
We have already imposed $6 trillion in new debt on future taxpayers in just two years. More spending would be reckless and extremely unfair as young people will have their own costs and crises to deal with down the road. Vaccinate people, repeal shutdown mandates, and the economy will recover by itself. That’s what market economies do. The government has already spent far too much.
The chart shows federal, state, and local government spending, with estimates for 2020 and 2021. It includes the almost $900 billion in relief spending passed in December, but does not include Biden’s proposed $1.9 trillion in new aid. If Biden’s plan passes, spending will easily top $9 trillion in 2021. Data are for federal fiscal years.
The patterns of spending and revenues in the current downturn differ from the Great Recession a decade ago. Back then, state-local government revenues dipped and federal revenues plunged. In the current downturn, overall government revenues are fairly stable.
During the Great Recession, total government spending rose about $1 trillion, and then flatlined for a few years before rising again. This time, spending jumped about $2 trillion.
Even without a Biden stimulus bill, spending will be about $8.2 trillion in 2021, up $1.4 trillion from 2019. Even if one believes that deficit spending helps the economy, there will already be about $2.6 trillion of it in 2021 without a Biden bill.
Data Notes
The data for 2005 to 2019 are from Table 14.1 and 14.2 here. Federal spending and revenues for 2020 are here. For 2021 federal spending, I assumed CBO’s baseline plus $875 billion from the December aid bill. For federal revenues, I assumed 2021 will be the same as 2020. State and local spending and revenues for 2020 are calculated from BEA quarterly data in Table 3.3 here, and 2021 is assumed to be the same.

