Thirty years ago, NASA scientist James Hansen put greenhouse-effect warming on the map with his strident testimony indicating that global temperatures could then confidently be related to changes in atmospheric carbon dioxide. Two years ago, he made another prediction: several meters of sea level rise in this century. He told Scientific American:
Consequences [of climate change] include sea level rise of several meters, which we estimate would occur this century or at latest next century, if fossil fuel emissions continue at a high level. That would mean loss of all coastal cities, most of the world’s large cities and all their history.
There’s only one way to accomplish this: melt a substantial portion of Greenland’s ice. In fact, as early as 2004 he wrote Greenland could a substantial portion of its ice in 100 years with the warming of this century, causing a total sea level rise of nearly 20 feet.
Fortunately, there are ways to test the hypothesis that Greenland is about to shed like a calico cat in the summer. It turns out Greenland has experienced multiple millennia of heat at times during the last 125,000 years.
The last two million years or so have been punctuated by (at least) four major ice ages. The reigning theory is that they are driven by slight but predictable variations in earth’s orbit around the sun, as well as the opening of the circumpolar Southern Ocean and the rise of the Himalayas. Our orbit is an ellipse in which the relation to the sun changes over time. Right now, earth is closest to the sun in Northern Hemisphere winter, and furthest away in summer. Under some conditions, that would lead to an ice age, but the seasonal distances between earth and sun also precess with time, and our orbit is right now quite circular. That makes the winter-summer difference small, preventing another ice age.
At the end of each of the last two ice ages, earth and sun lined up in a position where they are closest in Northern Hemisphere summer, and the orbit was highly elliptical, which means excess sunshine in the high latitudes, warming Greenland, and northern Eurasia and North America—a lot.
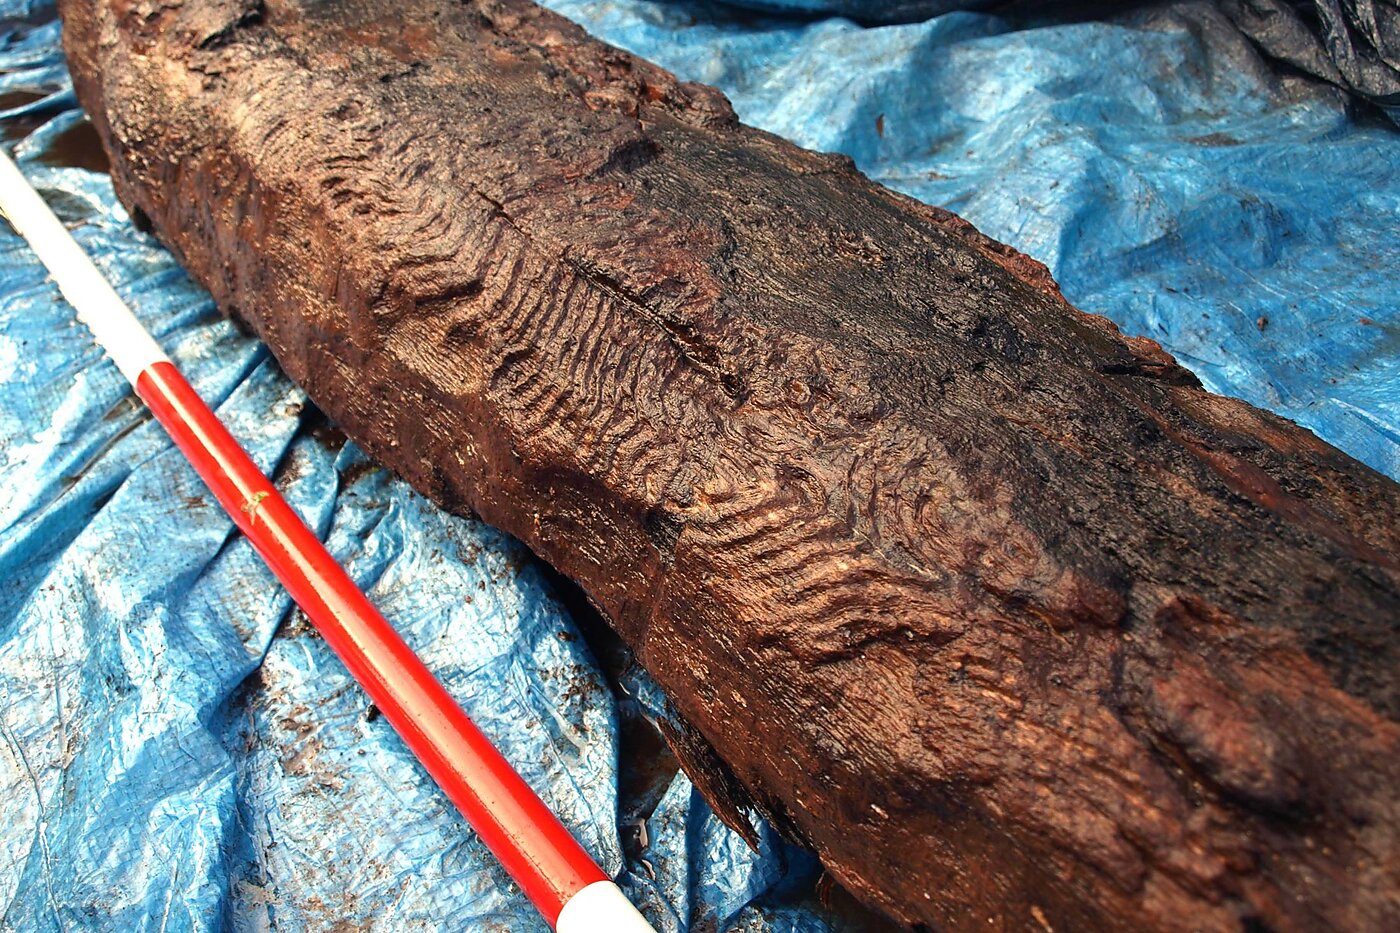
The Arctic tundra holds many secrets, including the fact it was once forested. It’s now too cold for trees, but we also know how warm it has to be for trees to survive. Dying trees buried in highly acidic peat are preserved remarkably intact. Here, for example is a log, radiocarbon dated at 6,000 years old that looks like new wood:
We became interested in this years ago, with the 2000 publication by Glen MacDonald, of UCLA, and several colleagues, showing that from roughly 7,000 to 9,000 years ago, “mean July temperatures along the northern coastline of Russia may have been 2.5° to 7.0°C [3.6° to 12.6°F] warmer than modern.” This is consistent with the 2016 finding of Jason Briner (University of Buffalo) that the difference between warmest and coldest postglacial millennia is 5.4° +/- 1.8°F in Arctic Canada and Greenland. Last year, dating buried wood and cones, Leif Kullman found high latitude summer temperatures at least 3.6°C [6.5°F] warmer than today, between roughly 6,500 years to 11,200 (!) years ago.
What did all this mean for Greenland? According to a very recent paper by Lisbeth Nielsen of University of Copenhagen, all that warming melted enough ice to raise sea level between ~0.15–1.2m (0.5–4.0 ft) over several thousand years. That’s a far cry from Hansen’s 20 feet in a hundred years, and it’s telling that the 2016 Briner finding and Hansen’s forecast were concurrent.
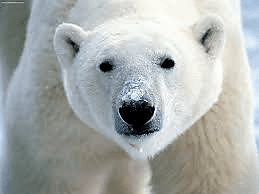
It’s also noteworthy that, due to all this arctic warming, “Arctic sea ice cover was strongly reduced during most of the early Holocene and there appear to have been periods of ice free summers in the central Arctic Ocean.” And yet this creature survived:
All this recent research is consistent with a landmark 2013 paper by Dorthe Dahl-Jensen and several colleagues from the University of Copenhagen, who drilled a core through the Greenland ice to the beginning of the previous interglacial–125,000 years ago, through the millennia known as the Eemian warmperiod.
If one thinks it was warm at the beginning of the current interglacial, the beginning of the last one was sweltering at high northern latitudes, given the Dahl-Jensen data. It used to be thought that a 6,000 year period, centering around 118,000 years ago, was around 3.6–5.4°F (2–3°C) warmer in summer than the 20th century average for Greenland. But data in their core showed it averaged 10.4–14.0° (6–8°C) warmer in summer for 6,000 years. And for all of that, they estimate that Greenland lost about 30% of its ice, which would raise sea level about about 1.38 inches per century over these six millennia. Not a Hansenian 20 feet, in a hundred years, but about 6/1000’s of that.
Quantitatively, here’s why Hansen’s hypothesis is wrong.
Assume that the six-millenia Eemian averaged around the lower level of Dahl-Jensen’s estimate, some 6°C warmer in summer. That means the melting heat-load (Greenland’s ice melts every summer) over Dahl-Jensen’s core region (northwestern Greenland) was:
6000 summers X 6°C = 36,000 degree-summers.
It’s doubtful we are going to warm our atmosphere with increased carbon dioxide for anywhere near 1,000 years, and climate models project a summer warming around Greenland in the top range of around 5°C. But let’s assume these pessimistic parameters.
Although this is likely a huge exaggeration of the heat that humans could possibly unload on Greenland, it is
1000 summers X 5°C = 5,000 degree-summers.
Therefore, in a 1000-year worst-case scenario we will only melt a small fraction of Greenland’s ice, compared to the loss in the 6000-year Eemian.
That’s a far, far cry from Jim Hansen’s 20 feet in 100 years. When his alarming sea-level rise hypothesis comes up (as it will) around the 30th anniversary of his 1988 testimony on June 23, rest assured that thousands of years of ice core data—real data instead of a speculative hypothesis—show the Greenland-driven disaster scenario to be simply untrue.
Finally, we just published a critique of Hansen’s 1988 overall forecast in the June 22 Wall Street Journal.
