The Congressional Budget Office has released final budget numbers for fiscal year 2009. The numbers allow us to take a last look at the Bush administration’s record on spending from a statistical point of view.
The following three charts show annual average real (or constant dollar) outlays during the tenures of recent presidents. Presidents were in office for either 4 or 8 budget years, except JFK (3 years), LBJ (5 years), Nixon (6 years), and Ford (2 years).
President George W. Bush’s last year was fiscal 2009. Outlays that year were $3.522 trillion, according to the CBO. However, $108 billion was spending for the 2009 economic stimulus package passed under President Obama. Bush was thus roughly responsible for $3.414 trillion of spending in 2009, which includes outlays for the financial bailouts enacted under his watch. (For FY2009, $154 billion for TARP and $91 billion for Fannie and Freddie).
Spending in Bush’s first year (FY2001) was $1.863 trillion, thus he presided over an 83-percent increase in overall federal spending, which includes defense, domestic, entitlements, and interest. Even without TARP and Fannie/Freddie, spending was up a huge 70 percent under Bush over eight years. By contrast, total spending under eight years of President Clinton increased just 32 percent. These are the overall increases in nominal dollars.
Now let’s look at the real annual averages. Figure 1 shows the average increase in total spending under recent presidents. Bush II was the biggest spender since LBJ. His spending increases were far larger than the three prior presidents.
Of course, presidents share spending power with Congress and it is easier for presidents to control discretionary spending than entitlement spending. Nonetheless, the results in these charts reflect the general spending approach taken by the presidents quite well. For example, Bush II was instrumental in adding the Medicare drug benefit, which by 2009 was adding more than $60 billion a year to federal spending.

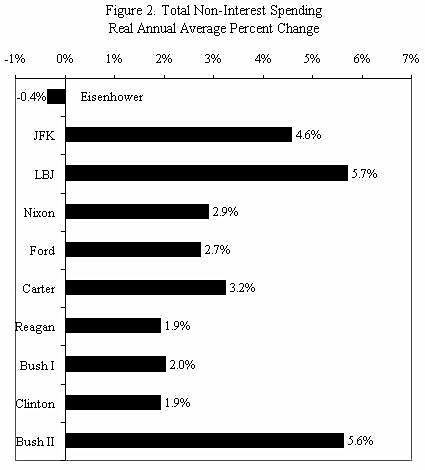
Figure 2 shows total federal spending without interest payments. Presidents have the least discretionary control over interest. The biggest spenders by this measure were again LBJ and Bush II. Note that Bush’s record by this measure is worse than in Figure 1. That is because Bush lucked out with relatively low interest rates on the federal debt and relatively low amounts of federal debt because of four years of surpluses under President Clinton.
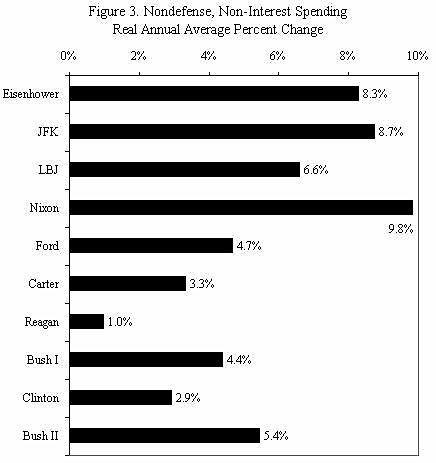
For Figure 3, I took out both interest payments and defense spending from the totals. So spending includes domestic discretionary spending and so-called entitlement spending–in other words, mainly spending on the growing federal welfare state. By this measure, Eisenhower, JFK, LBJ, and Nixon had awful records. These were the years of massive creation and expansion of federal subsidy programs for the elderly, state governments, and many other groups. By the late-1970s, the creation of new programs had slowed but existing programs continued to grow.
The 1980 election of Ronald Reagan represented a revolt against the rapidly expanding welfare state. His record shown in Figure 3 of just 1 percent real spending growth over eight years was impressive, at least relative to the other presidents of the last half century.
What about Bush II? Figure 3 shows that he was the biggest domestic spender since Nixon. He set the stage for the explosive spending growth we are seeing under President Obama. Big spending was a key cause of Bush’s failure as president both economically and politically, and it is proving just as damaging and unpopular under President Obama.