The latest international academic assessment results are out—this time focused on 4th grade reading—and the news isn’t great for the United States. But how bad is it? I offer a few thoughts—maybe not that wise, but I needed a super-clever title—that might be worth contemplating.
The exam is the Progress in International Reading Literacy Study—PIRLS—which was administered to roughly representative samples of children in their fourth year of formal schooling in 58 education systems. The systems are mainly national, but also some sub-national levels such as Hong Kong and the Flemish-speaking areas of Belgium. PIRLS seeks to assess various aspects of reading ability, including understanding plots, themes, and other aspects of literary works, and analyzing informational texts. Results are reported both in scale scores, which can range from 0 to 1000, with 500 being the fixed centerpoint, and benchmark levels of “advanced,” “high,” “intermediate,” and “low.” The 2016 results also include a first-time assessment called ePIRLS, which looks at online reading, but it includes only 16 systems and has no trend data so we’ll stick to plain ol’ PIRLS.
Keeping in mind that no test tells you even close to all you need to know to determine how effective an education system is, the first bit of troubling news is that the United States was outperformed by students in 12 systems. Among countries, we were outscored by the Russian Federation, Singapore, Ireland, Finland, Poland, Norway, and Latvia. Some other countries had higher scores, but the differences were not statistically significant, meaning there is a non-negligible possibility the differences were a function of random chance. Also, between 2011 and 2016 we were overtaken by Ireland, Poland, Nothern Ireland, Norway, Chinese Taipei, and England.
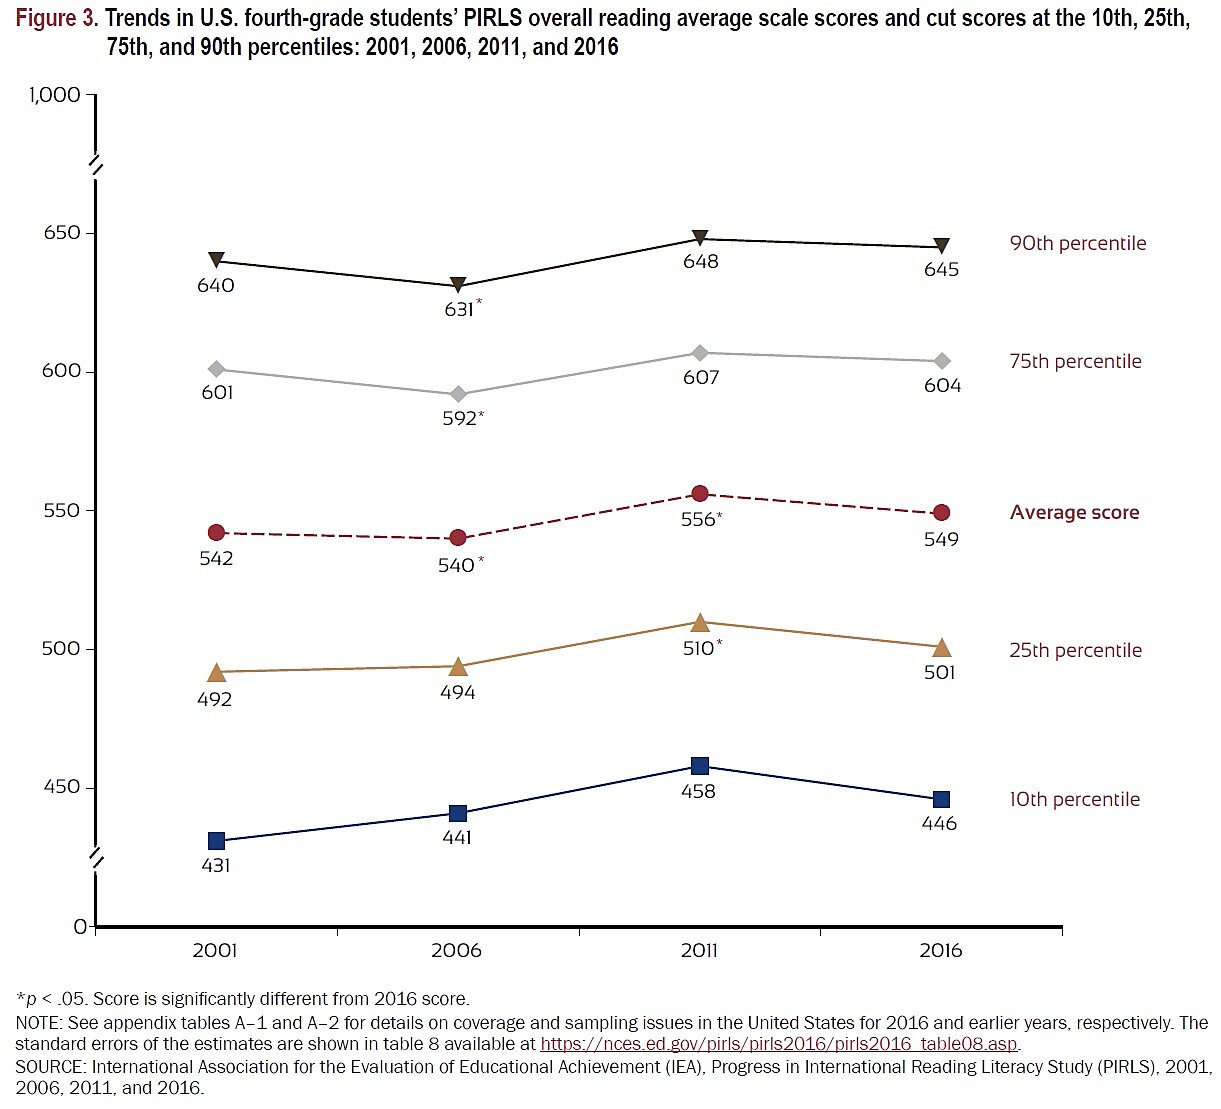
The second concerning finding is that, on average, the United States has made no statistically significant improvement since 2001. As the chart below shows, our 2016 result was not significantly better than our 2001 score. We appear to have made some strides between 2001 and 2011 but have clearly dipped since then.
A few thoughts:
- It is tempting to attribute the gains between 2001 and 2011 to the No Child Left Behind Act, and it is certainly possible that the standards-and-accountability emphasis of the NCLB era helped to goose scores. It is, however, impossible to conclude that without looking at numerous other variables that affect test scores, including student demographics and such difficult-to-quantify factors as student motivation. More directly, NCLB was passed in very early 2002, so by 2006 it had had several years to start working. But that year reading scores went down for all but the lowest 25 percent of test takers. By 2011, the next iteration, NCLB had become politically toxic.
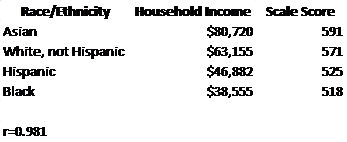
- The U.S. PIRLS results are broken down by various student attributes, including race/ethnicity. We need to be very careful about these blunt categories—they contain lots of subsets, and ultimately reduce to millions of individuals for whom race or ethnicity is just one among countless attributes—but they might hint at something of use. Most interesting, perhaps, is that scores for Asian Americans (591) beat the top-performing systems, the Russian Federation (581) and Singapore (576). This might suggest that there is something about culture— East Asian culture especially is thought to focus heavily on academic achievement, general American culture not so much—and that the education system itself might play a relatively small role in broad academic achievement.
- Or maybe it’s not culture, or culture is wrapped up in lots of other things such as business success, or Asian Americans tend to arrive from wealthier backgrounds to begin with. As seen below, a simple correlation between median household income for each group and their 2016 score is almost perfect at 0.98. (A perfect positive correlation would be 1.0). This also suggests that the system does not have nearly the impact of other factors, but whether it is culture, wealth, or some intertwining of those and many other factors is unclear.
- If the system does not matter, at least for standardized reading assessments, then what really hurts about U.S. education policy is that we spend more per-pupil than almost any other country for which we have data but get pretty mediocre results. As of 2013 we spent $11,843 per elementary and secondary student, and in 2016 were beaten by several countries that spent less, including Latvia ($5,995), Poland ($6,644), Ireland ($9,324), and Finland ($9,579).
- That factors such as culture might matter much more than spending or the system might explain why American school choice programs tend to produce only slightly better standardized test scores but at a fraction of the cost of public schools. Of course, there are also many things people want out of education that might be much more important to them than test scores—raising morally upright, compassionate, creative human beings, for instance—and freeing people to get those things might be the most important and compelling argument for school choice.
That’s it for PIRLS 2016 musings. On to the next standardized test results, and other things that may matter far more.
