We often hear that politicians have slashed tax rates on the rich repeatedly at the expense of other groups since Ronald Reagan was in office. A Washington Post report noted, “Many economists say decades of cuts to income tax rates on the highest earners are one of the drivers of the runaway inequality that’s come to characterize the modern U.S. economy.”
A new opinion column at Bloomberg claims, “In the past four decades, Congress after Congress has cut taxes on the richest people and corporations … In the four decades since ERTA [1981] was signed, Republicans — with some assists from Democrats — have worked to dismantle a system where the wealthiest people pay substantially higher rates.”
These narratives are off-base. Top-earning households have paid consistently high overall federal tax rates for decades, and middle- and lower-income households have received the largest relative tax cuts since the 1980s.
The Congressional Budget Office has released new estimates of income and taxes for 2019. The chart on page 18 shows total federal taxes as a percent of income. Federal taxes include individual income, corporate income, payroll, and excise. The average tax rate on the top 1 percent has hovered above 25 percent since 1979. The average rate on middle-income households has fallen to 14 percent, and the average rate on the bottom one-fifth of households has plunged to near zero. The largest tax cuts have been at the bottom.
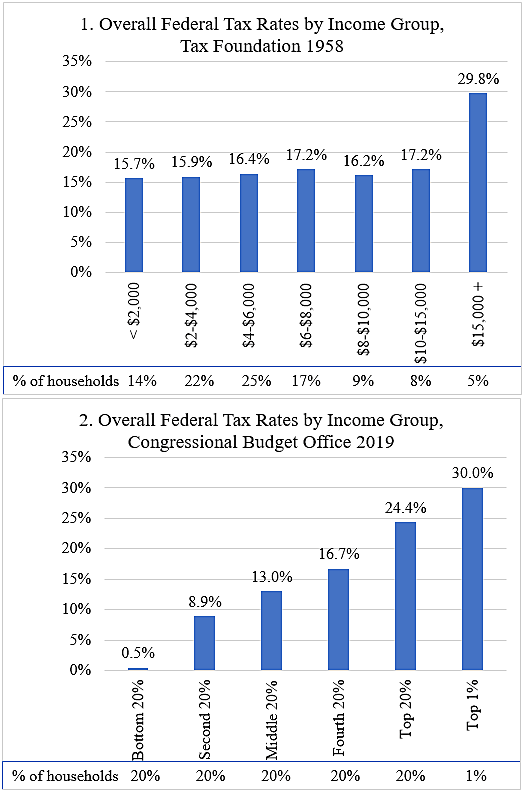
Let’s go back further. This study by Tax Foundation estimates taxes by income group in 1958. The estimates include federal individual income, corporate income, payroll, excise, and estate taxes. Let’s compare these 1958 data to the new data from CBO.
Figure 1 shows that average federal tax rates were roughly proportional across income groups in 1958, except that the top group paid a much higher rate. Lower- and middle-income households paid substantial federal taxes in 1958. Federal excise taxes—which hit low-income households heavily—have declined from 2.2 percent of GDP in 1958 to 0.3 percent today.
Figure 2 shows that federal taxes in 2019 were highly skewed. Lower-income households pay much lower tax rates than higher-income households. Also, while there are differences in methodology between the two estimates, it appears that bottom groups pay lower tax rates today than they did in 1958.
Looking just at individual income taxes, average tax rates in 1958 ranged from 1.8 percent for the bottom group to 16.3 percent for the top group. In 2019, individual income tax rates ranged from negative 11.1 percent for the bottom fifth to 30.0 percent for the top 1 percent. Today, refundable tax credits more than wipe out income taxes for many households near the bottom.
Even though the top statutory individual income tax rate has fallen from 91 percent in 1958 to 37 percent today, overall federal taxes appear to be far more “progressive” today than in the past.
Data Notes
The two charts reflect tax realities of 1958 and 2019, but some caution is in order. The figures use different methods to estimate and allocate income and taxes to income groups. For example, Tax Foundation attributes half the corporate tax to consumers, which bumps up burdens for lower- income households. Economists today would attribute the corporate tax to workers and shareholders, not consumers. Another difference is that the 1958 data includes estate taxes while the 2019 data does not.
If you’re interested in digging further into 1958 data, I noticed two other sources. This Department of Commerce publication, on page 16, appears to be where Tax Foundation sourced its individual income tax data. And this Census publication has detailed information on 1958 incomes.
