As policymakers begin fighting over this year’s appropriations, the Congressional Budget Office has released a long-term projection that puts today’s budget battles in broader context. The federal government is in the most unique and dangerous fiscal situation that it has ever been in during peacetime.
Federal spending and debt as a share of GDP are being sustained at very high levels, and that is sapping the nation’s economic vitality. Spending and debt remove resources from the voluntary, productive, and innovative sector of the economy and put those resources in the hands of the coercive, mismanaged, and centrally planned sector. The more that spending and debt rise, the more of our freedom and prosperity are destroyed.
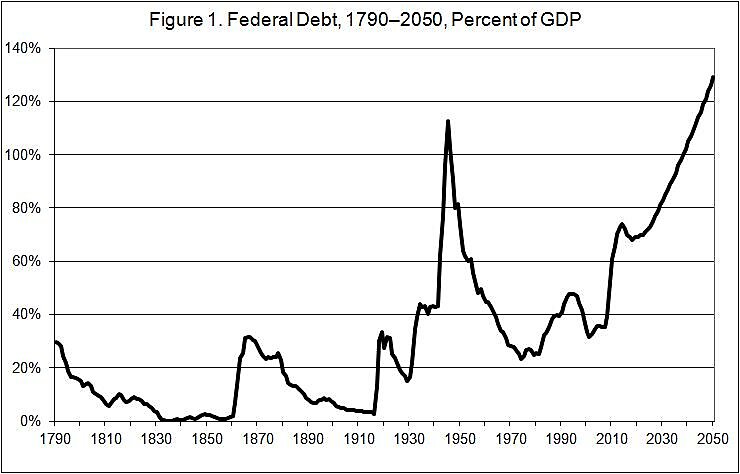
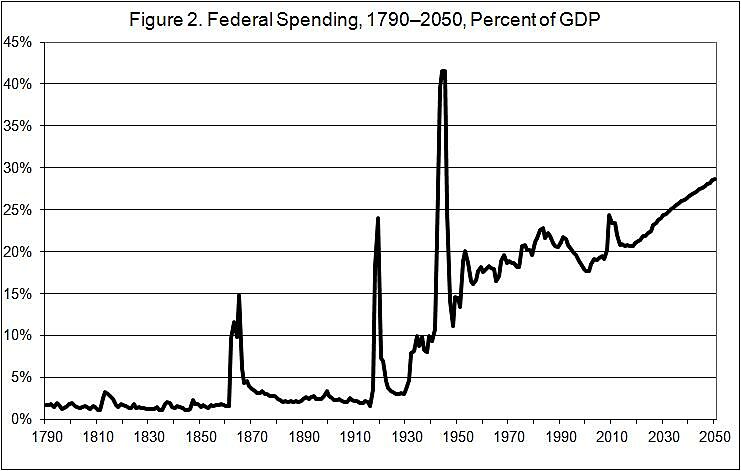
During brief periods to fight justified wars, it is reasonable to hand over more resources to the government. But the following two charts show that spending and debt are already at remarkably high levels for peacetime, and CBO projections to 2050 show the situation getting much worse.
Figure 1, below the jump, shows federal debt held by the public as a share of GDP from 1790 to 2050. The data for past years are from CBO analyses here and here. The projection is CBO’s new extended baseline.
Before the current spike, federal debt never rose above 48 percent of GDP during peacetime. Right now debt is 73 percent of GDP and CBO projects that it will rise to 129 percent by 2050 without reforms.
In the past, debt peaked during wars (the War of 1812, Civil War, WWI, and WWII), but afterwards there were always long periods of fiscal retrenchment. Indeed, for the nation’s first 140 years, the Jeffersonian dislike of government debt held sway among policymakers. The rise of Keynesianism in the 1930s started to soften views about debt, but the recent political acceptance of peacetime debt at near-WWII levels is very disturbing.
High debt is caused by high spending. Figure 2 shows total federal outlays over the same 260-year period. Spending data for the first 110 years are from the Census, while GDP data are from CBO. Data since 1900 are from OMB and CBO, and the projection to 2050 is CBO’s extended baseline.
The wartime spending spikes in Figure 2 match the debt spikes in Figure 1. But since the 1930s, the welfare state has grown dramatically, and federal spending has gobbled up an increasing share of the economy during both peacetime and wartime.
Wars tend to ratchet up spending even after the shooting stops, but before WWII this didn’t seem to be a severe problem. From 1790 to the War of 1812, federal spending averaged 1.5 percent of GDP. From after the War of 1812 to the Civil War, spending also averaged 1.5 percent. From the end of the Civil War to WWI, spending averaged 2.6 percent. During the 1920s, spending averaged 4.1 percent.
But after that point, Figure 2 shows a sharp upward trend from 1930 to about 1980. Spending rose from 4 percent to 21 percent of GDP—a quintupling of the federal government’s grab of the nation’s income. The federal share has gyrated around 20 percent since then, but CBO’s projection of spending to 2050 shows spending climbing to 29 percent. If we have more wars, there will be spikes in future spending and debt that make CBO’s scary projections even worse.
Regarding the current budget battle, the effort to remove Obamacare funding from this year’s appropriations is laudable. Not only will the health care law add distortions to our health care system, it will also spend a lot of money. Repealing the law would reduce federal spending by about half a percentage point of GDP annually within a decade.
However, much more needs to be done to ward off the tidal wave of spending and debt shown in the CBO projections. History shows that policymakers should be cutting spending and debt during periods when we are at peace and the economy is growing—like right now. Let’s hope that we don’t enter any more foreign wars, but we do need a domestic war on government spending and debt.


