As federal spending continues to rise, accumulated federal debt will soon reach all-time highs relative to the size of the economy. Federal debt held by the public will hit 107 percent of gross domestic product (GDP) in 2028, surpassing the previous peak after World War II. The Congressional Budget Office (CBO) often highlights the rising debt-to-GDP ratio as a warning for policymakers to change course and avert a debt crisis.
Another warning sign of a coming debt crisis is soaring interest costs. With interest rates rising, federal interest payments have doubled from 1.2 percent of GDP in 2015 to 2.4 percent in 2023. The government will pay $640 billion in net interest this year.
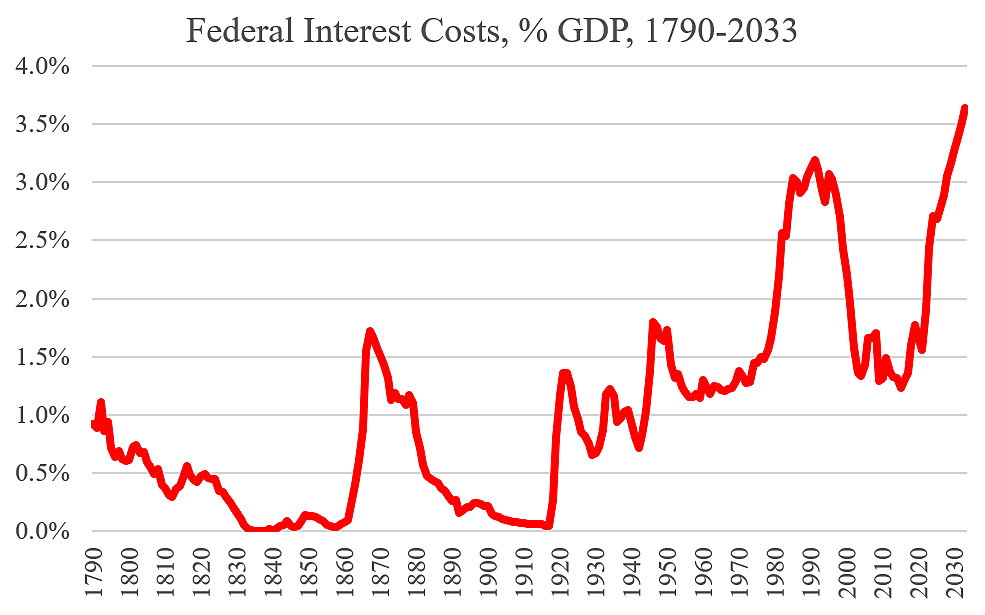
The chart shows federal interest costs entering uncharted territory in coming years, based on CBO projections. Interest costs will hit an all-time high in 2030 of 3.3 percent of GDP, surpassing the previous peak in 1991. By 2033, interest costs will hit 3.6 percent of GDP, double the peak reached after World War II.
Here is an explainer for the chart, noting that interest costs are determined by the level of debt and interest rates.
- 1790–1860. Interest costs declined as the young nation paid down the Revolutionary War debt, and then paid down debt from the War of 1812. By the 1820s, there was strong political support to fully pay off the debt, and President Andrew Jackson was able to do so by 1835, as I discuss here. Unfortunately, war with Mexico in the 1840s and other developments prompted the government to start borrowing again.
- 1860–1920. Debt and interest costs soared as the nation fought the Civil War. But the post-war decades were a period of prudent fiscal management. Congress ran budget surpluses 28 years in a row beginning in 1866, and interest rates were falling in the decades after the war.
- 1920–1942. Debt and interest costs spiked to pay for World War I, then fell as the government ran surpluses every year during the 1920s. Interest costs rose again in the 1930s as debt increased, but the costs were moderated by falling interest rates during the decade.
- 1942–1978. Federal debt soared to 106 percent of GDP in 1946 due to massive war costs. But the government was able to borrow at low interest rates, so interest costs relative to GDP were less than today. Interest rates were moderate during the 1950s and 1960s, and GDP grew strongly.
- 1978–2001. Debt began piling up in the late 1970s and interest rates spiked. Interest costs exploded, reaching a peak of 3.2 percent of GDP in 1991. But then in the late 1990s, bipartisan efforts to restrain spending combined with rapid economic growth greatly improved the budget situation. The government ran surpluses from 1998 to 2001.
- 2001–2023. The government began running deficits again in 2002, and debt began rising. Federal debt tripled as a share of GDP from 32 percent in 2001 to 98 percent by 2023. However, interest rates had been trending downward the past two decades, which moderated federal interest costs. That period has now come to an end. Since 2021, interest rates have been rising and federal interest costs are spiraling upward.
When it comes to the budget impact of federal debt, the rubber hits the road in interest costs. No more can federal policymakers rely on low interest rates to keep their overspending juggernaut rolling. They need to reverse course as they did in the 1990s. They should restrain spending, balance the budget, and support policies that grow the economy.
Data Notes: For 1790–1939, interest payments are Census series P102 here. For 1940 to today, net interest is OMB data, and then the projection to 2033 is CBO. In 1940, the Census figure is 16 percent larger than the OMB figure, so there is a bit of a discontinuity. Historical GDP from 1790 to 1929 is from CBO here. A historical chart on debt is here and one on interest rates is here.

