The VA scandal has prompted a debate about whether it should be easier to fire federal workers. I’ve argued that the firing rate for poor performance should be increased.
However, there can be no debate that the current firing rate is very low. In 2013 just 9,244 workers out of a civilian federal workforce of 1.87 million were fired for poor performance or misconduct, according to OPM data underlying this Govexec.com article by Eric Katz. That is a rate of just 0.49 percent, or 1 in 200 a year. Most federal firings are for misconduct, with a smaller share for poor performance.
The Govexec.com analysis found that firing rates by type of employee vary dramatically. Blue collar and lower GS levels (1–10) are many times more likely to be fired than higher GS levels (11–15) and those in the Senior Executive Service (SES). The GS 11–15 firing rate was just 0.14 percent, while the SES rate was just 0.09 percent. Just 7 out 7,940 SES employees got fired in 2013. What would Piketty say about that?
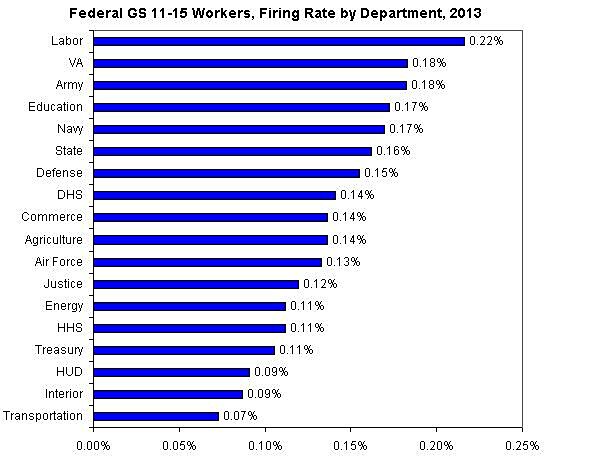
Govexec.com charted the firing rates by department, but part of the differences stemmed from the type of workforce each department has. So, instead, let’s focus on just the largest group of civilian workers in the government—the GS 11–15 group—and see how firing rates vary. These differences may tell us more about how employment cultures differ between departments.
Govexec.com kindly provided me their firing-by-department data sourced from the OPM. I combined that information with data from these OPM tables on total GS 11–15 employment by department.
The chart shows the results. Annual firing rates vary from a low of 0.07 percent in Transportation to high of 0.22 percent in Labor. In Transportation, just 9 out of 12,389 GS 11–15 workers were fired in 2013. In HUD it was just 7 out of 7,703. In Education it was 6 out of 3,477.
VA has one of the highest firing rates for this class of worker at 0.18 percent. But that’s still just 1 in 555 workers in 2013.

