The Federal Reserve chairman and Federal Open Market Committee (FOMC) always imagine that they can prevent recession by anticipating trouble in time to stop it. If that were true, soft landings would be the norm rather than a freak rarity.
At his July 31 press conference, Fed Chair Jerome Powell remarked, “We know that reducing policy restraint … too late or too little could unduly weaken economic activity and employment.… If the labor market were to weaken unexpectedly, we are prepared to respond. Policy is well positioned to deal with the risks and uncertainties that we face.”
Prepared and well positioned? That would be a unique surprise. The Fed has an almost perfect record of raising the federal funds rate on bank reserves only after inflation surges are well underway. And it has an even better record of cutting interest rates only after recessions are likewise underway, always too late and usually too much.
Was the Fed prepared and well positioned to deal with unexpectedly high inflation from the second quarter of 2021 to the second quarter of 2022? From October 2008 to May 2022 the federal funds averaged 0.5 percent and was almost always near zero (rising above 2 percent only from October 2018 to September 2019). The Fed did not respond at all as the year-to-year personal consumption expenditures (PCE) inflation rate rose to 4.1 percent in the second quarter of 2021, 4.7 percent in the third, and 5.9 percent in the fourth. By the second quarter of 2022, inflation reached 6.8 percent. Yet the fed funds rate in 2022 was only 1.2 percent in June 2022, 1.7 percent in July, and 2.3 percent in August.
Conversely, when it comes to “reducing policy restraint” to prevent recessions, consider what happened in 2008. By June 2008, the economy had been in recession for six months, but no Fed governor or regional bank president expected even a future recession in their June dot-plot “projections” for 2008–2010. Even when the oil shock recession was aggravated by financial crisis in the next two months, the FOMC remained unprepared to act.
This is what happened in 2008 and how the Fed reacted, as documented by the New York Times:
- August 5: “The F.O.M.C. holds interest rates steady. It frets that inflationary pressures are building. Three of the regional reserve banks want to raise interest rates.”
- September 7: “The Federal Housing Finance Agency places Fannie Mae and Freddie Mac in government conservatorship.
- September 15: Lehman Brothers files for Chapter 11 bankruptcy protection; Bank of America buys Merrill Lynch.”
- Sept. 16: “The F.O.M.C. continues to hold steady on rates. Most Fed officials say they still believe the economy is growing, still predict it will grow in the final months of 2008 and grow more quickly in 2009. And they still fret that inflation is rising.”
Previously, at a Federal Reserve policy meeting on November 20, 2007, a month before the Great Recession began, the FOMC introduced a new quarterly Summary of Economic Projections (SEP). These highly publicized quarterly projections, from Federal Reserve governors and reserve bank presidents, became famous as a scatter diagram called the “dot-plot.” Barely seven months after the November 2007 launch, however, this new FOMC central planning ritual failed spectacularly.
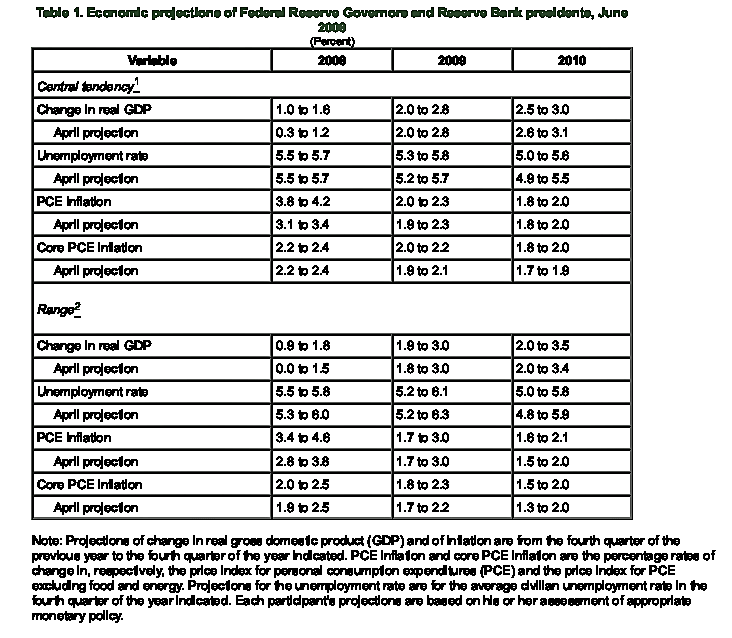
The SEP dot-plot projections from June 12, 2008, are shown in Table 1. By that time, the economy had already been in recession for half a year. Yet nobody at the FOMC in mid-2008 imagined recession was a serious threat. Indeed, “some participants pointed to the apparent resilience of the US economy … and suggested that the adverse effects of financial activity outside of the housing sectors could prove more modest than expected.”
SEP tables reveal participants’ projections of the percentage change in real GDP and PCE inflation between the fourth quarters of each year. They also post the unemployment rate expected in the last quarter.
The top panel in Table 1 instead highlighted the “central tendency” of these estimates in June 2008. Instead of using a median as an average (which became common later), this “trimmed mean” eliminated the highest and lowest three. To emphasize that not one of the projections was remotely close to being right, I prefer to focus on the bottom panel—which shows the entire range of estimates for all 12 participants.
Meeting in the middle of 2008, with half the year behind them, not one of the June 2008 FOMC projections imagined the 18-month recession that started that January would happen at any time in 2008, 2009, or 2010. Projections of real gross domestic product (GDP) growth by year-end ranged from 0.9 percent to 1.8 percent. Yet actual real GDP growth in 2008 was sharply negative—down 2.5 percent by the fourth quarter. For 2009, the Fed’s June 2008 projections expected real growth of 1.9 to 3.0 percent. But economic growth in 2009 was roughly zero, 0.1 percent.
The June 2008 FOMC SEP projected PCE inflation of 3.4 to 4.6 percent between the fourth quarters of 2007 and 2008. But actual inflation was only 1.2 percent in 2008 and 2009.
The unemployment rate in the June 2008 dot-plot was projected to be 5.5 to 5.8 percent in the fourth quarter of 2008, and 5.2 to 6.1 percent in the fourth quarter of 2009. But the unemployment rate reached 6.9 percent by the last quarter of 2008 and 9.9 percent by late 2009. Unemployment remained above 9 percent until the end of 2011 and did not return to pre-recession levels until 2014.
Table 1: FOMC summary of economic projections, June 2008
The Fed has only once managed to keep the federal funds rate above 5 percent for a long time without recession, from November 1994 to November 1998 (even as PCE inflation fell from 2.1 percent in 1994 to 0.8 percent in 1998). Before that, the longest such “higher-for-longer period” experiment with such a high central bank interest rate lasted only 14 months—when the New York Fed kept the discount rate at 5–6 percent from August 1928 to October 1929. That ended with the Great Depression.
The FOMC’s third major experiment with a higher-for-longer strategy lasted from June 2006 to September 2007, when the federal funds rate was kept above 5 percent for over a year. That ended with the Great Recession.
The latest higher-for-longer Fed marathon, which began August 2023, is now almost a year old and still being tested.
The 2008 Fed projections were dangerously slow to react to the unfolding recession, remaining strangely more concerned about an assumed inflationary impact of a global oil price spike. They forgot that oil price spikes are reliable omen of recession (and of Fed mistakes). High oil prices and a high fed funds rate preceded every postwar US recession since 1957 except one (1960). Oil prices and the fed funds rate spiked before the recessions of 1957, 1970, 1974, 1980, 2001, and 2008.
Figure 1: Weekly oil prices and the federal funds rate 2007–2014
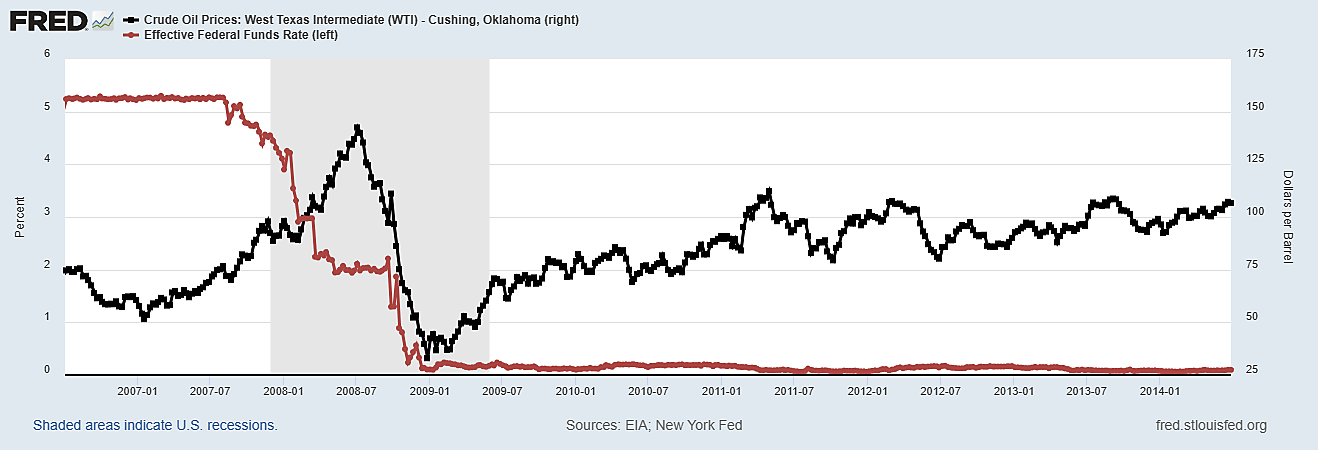
As Figure 1 shows, shortly after the June 2008 FOMC meeting, on the week ending July 4, the spot price of West Texas Intermediate (WTI) crude oil peaked at $142.52 a barrel, and the fed funds rate was 2.2 percent. Oil then fell to $97.19 by the week ending September 19, and the Fed cut the funds rate below 1.3 percent.
By Christmas 2008, WTI crude reached a weekly low of $32.98, and the Fed fund rate had been slashed to essentially zero (0.14 percent) where it remained until May 2022, aside from October 2018 to September 2019.
The hubris of central banking relies on what F. A. Hayek called “the pretense of knowledge.” Like the quaint central planners of socialist fantasies, the pretense is that a dozen experts can somehow steer the entire US economy with a tiny rudder—the overnight “policy rate” paid to banks for holding reserves at Fed district banks. Even if that worked as planned, it requires forecasts because using past data to set future policy is doomed by the long and uncertain lags between Fed actions and business and household reactions.
Just as the FOMC was astonishingly slow to react to the inflation surge in 2021and early 2022, they were equally blindsided in 2008 by another oil price shock recession—despite the Fed having repeatedly made the identical blunder in other recessions of keeping interest rates high because oil prices were high.
Keeping Fed policy unchanged until the Fed’s committee could agree about obvious risks of inflation or recession caused costly procrastination errors in 2008 and again in 2021–2022.
Top Fed officials today apparently remain as confident as they were in mid-2008 that they will get it right this time—by reacting to “the data” in plenty of time to avoid a recession. But economic data looks backwards, not forward. Because monetary policy works with a long lag, Fed policy must be based on forecasts. Unfortunately, FOMC forecasts have a dismal record.
