A Wall Street Journal editorial (“Inflation Haunts the Biden Economy”), fears that “one risk is the Fed gets spooked by the market reaction to its tightening.” However, the stock market is rarely hyper-sensitive to Fed statements or actions for more than a few days.
“Stocks Turn Lower After Fed Announcement” was the Journal’s January 26 headline, yet the Fed chairman did not actually announce anything much different from what was already expected – namely, phasing-out the “Quantitative Easing” routine plus several quarter-point increases in the IORB (Interest on Reserve Balances) and the more familiar federal funds rate.
Nobody was betting on an easier Fed policy after January 27, yet the S&P 500 nonetheless rose by another 4.2% by the time the market opened uneasily on February 11 following a surprisingly bad CPI report that led many to speculate about an imminent half-point rise in the fed funds rate. Why? Probably because COVID-19 infections were down, and earnings were up. The Fed cannot easily trump good news.
We have seen this show before, but it rarely has a happy conclusion. Most recently, the Fed raised the fed funds rate in nine little steps from 0.08% in November 2015 to 2.4% in December 2018 and kept it there through July 2019. The first 5 or 6 hikes in the fed funds rate in 2016–18 had no sustained impact on the upward trajectory of stock prices.
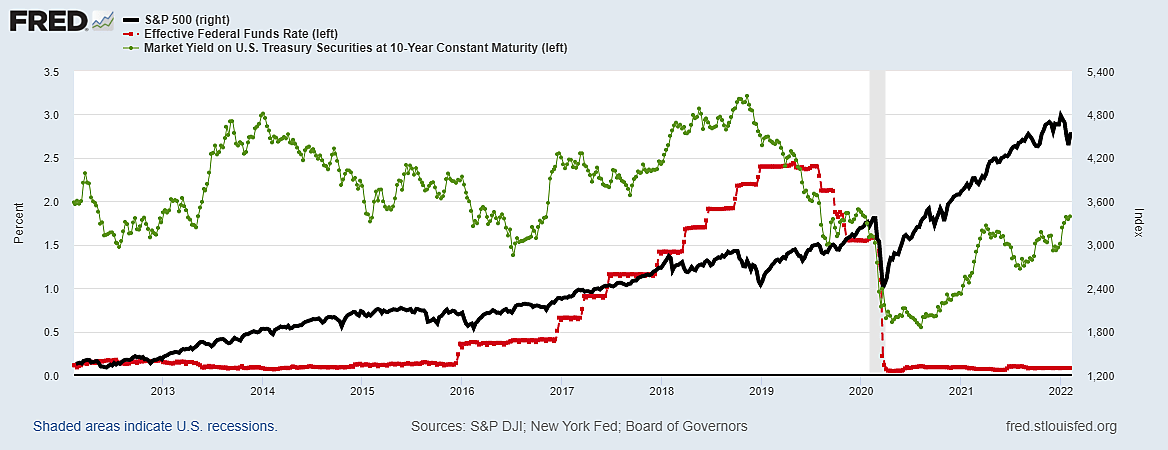
As the first graph shows, the black line for the S&P 500 kept rising until the final two increases in short-term rates, when the fed funds rate rose above 1.9% and the 10-year bond briefly topped 3% before falling quickly
Although stock market averages appeared initially unperturbed by the 2016–19 notching-up of the fed funds rate, the market can react negatively to bond yields if (1) higher yields reduce the price-earnings multiple for stocks, but also if (2) long-term bond yields rise very little as the Fed pushes short-term rates higher, thus flattening the yield curve.
The price-earnings multiple is affected by large changes in long-term interest rates because a higher rate reduces the discounted present value of expected (but uncertain) future earnings. But raising the fed funds rate does not necessarily raise bond yields and may sometimes lower them by creating expectations of slower income growth (as in 2019) thus inverting the yield curve shown as a black line in the second group.
As the Journal editorial emphasized, the Fed needs to stop buying more Treasury debts and start rolling back its bloated balance sheet. This may not prove as troublesome as paying escalating interest rates on bank reserves (IORB). Thomas Hogan points out that the Fed’s massive asset purchases had no visible impact on bank lending which “remains below the level of the pre-crisis trend.”
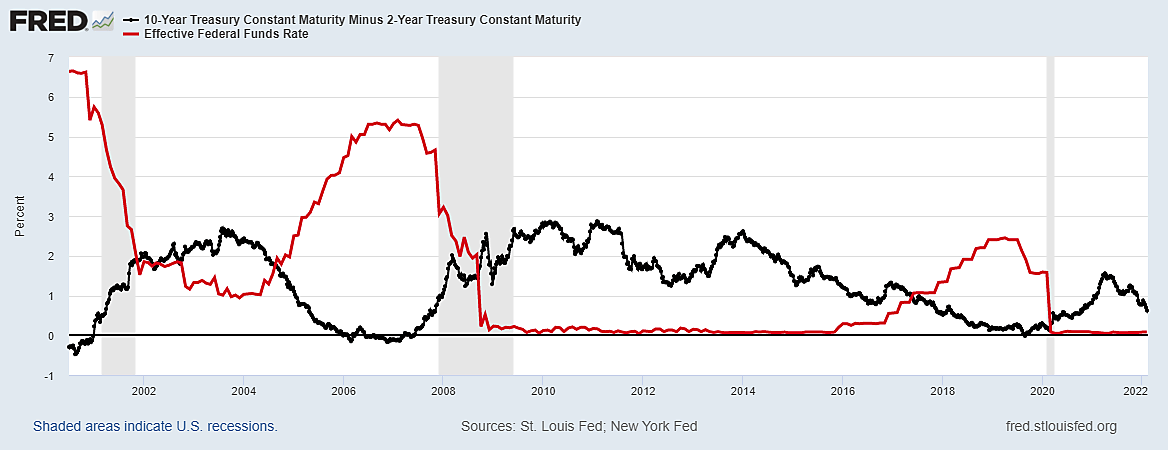
What does affect bank lending, however, is the yield curve – shown as a black line in the second graph with the fed funds rate in red. Past increases in the fed funds rate have succeeded in pushing short-term rates (the 3‑month T‑bill in this case) above the 10-year bond yield. Since banks make money by borrowing short and lending long, an inverted yield curve is a well-known leading indicator of recession as well as stock market crashes.
During the last major spike in oil prices and inflation (“The Great Recession”) the Fed engaged in massive Quantitative Tightening(QT): Federal Reserve Bank holdings of Treasury debt were deliberately reduced from $790.5 billion in the second quarter of 2007 to $478.2 billion in the second quarter of 2008, as the price of Texas crude oil nearly tripled from $50 to $145 a barrel. What did all that QT do to yields on 10-year bonds? They fell – from 5% in early July 2007 to 4% a year later.
The experiment with quantitative tightening was soon followed by three tests of Quantitative Easing (QE) which, I recently noted, were not nearly as successful in lowering bond yields as QT had been. “During QE1 ($1.5 trillion) the 10-year Treasury yield rose from 2.97% on March 16 to 3.84% on March 31, 2010, then fell after QE1 ended. During QE2 ($827 billion) the 10-year yield fell from 2.67% on November 3, 2010 to 1.67% by June 29, 2012, but yields dipped even lower for months after it ended. Under QE3, yields rose from 1.86% at the start of 2013 to 3.04% by the end of the year, but then fell steadily to 2.34% by the end of the famous ‘taper’ in October 2014 and continued falling after that.”
In the past two years, the Fed’s portfolio further exploded to $8.9 trillion, but that cannot begin to explain the gyrations in U.S. bond yields in the first graph nor the collapse of global bond yields when the pandemic shut down much of the world economy.
The stock market is not nearly as sensitive to the Fed-managed overnight interest rates as many assume, nor are bond market yields or bank lending so clearly affected by quantitative easing on tightening. Unless the Fed bungles into crushing finance and the economy by inverting the yield curve, which does not seem an imminent threat, stocks in U.S. companies are still the best place to seek long-term returns.
