The Federation for American Immigration Reform (FAIR) recently released a report on illegal immigrant incarceration rates that is poorly contrived and terribly executed. FAIR uses the number of illegal immigrants counted under the State Criminal Alien Assistance Program (SCAAP), which compensates local and state governments for incarcerating some illegal immigrants, to calculate the illegal immigrant incarceration rate. FAIR finds that illegal immigrants, as measured by the number of SCAAP aliens, are incarcerated at much higher rates than natives and legal immigrants according to their faulty methods.
There are many problems with FAIR’s report.
The first problem is that it doesn’t state what year or period of years that it is analyzing. I can’t even work backward because their citations only indicate when they accessed the relevant data, not which annual data they accessed. This means that it would take many dozens of hours of guesswork to recreate their work.
The second problem with using SCAAP data is that they are the oddest crime data. The SCAAP aliens are a measure of the stock and flow of illegal immigrants into state and local correctional facilities over a year. SCAAP is used to compensate local communities and states for the costs of incarcerating some illegal immigrants, it is not designed to be used to estimate illegal immigrant incarceration rates. As a result, the normal operation of dividing the number of prisoners who are in SCAAP by the stock of all prisoners to calculate a rate is not useful here because the proper denominator is the stock of the prison population at the beginning of a year plus the number of people admitted throughout the rest of that year. However, FAIR uses just the stock of the population in state prisons at the end of the year plus estimates from a private group for the number of people incarcerated in local facilities. FAIR does not add the flow to the stock to estimate a proper denominator.
As a result, there is no correct way to use SCAAP data to estimate incarceration rates because there is not a similar number published by the government that can serve as a denominator. Using the Bureau of Justice Statistics (BJS), one can estimate a flow plus stock denominator for some years without eliminating the significant problem of overcounting. Although I caution against drawing a lesson from this back of the envelope calculation, Stephen Dinan of the Washington Times piqued my curiosity and I could not resist. This is the only way to use SCAAP data to estimate illegal immigrant incarceration rates in state prisons.
My back of the envelope calculation uses only the state-level incarceration numbers and excludes the number of local SCAAP prisoners and people jailed on the local level. This is because the BJS does not collect the local numbers and they are not available for many years. The number of illegal immigrants nationwide comes from the Department of Homeland Security (DHS) while the number of non-illegal immigrants (legal immigrants and native-born Americans) comes from the American Community Survey. I merely divided the number of SCAAP aliens nationwide who were incarcerated and who entered state correctional facilities by the number of illegal immigrants nationwide in each year. I then compared that rate to the same rate for non-illegal immigrants who were in correctional institutions that year or that entered them. Lastly, I presented the figure per 100,000 for each subpopulation because that is common in the crime literature.
Figure 1 shows the nationwide results: Illegal immigrants in the SCAAP program are incarcerated at a lower rate than non-illegal immigrants. Just to reiterate, this is back-of-the-envelope calculation with significant problems. It excludes all prisoners incarcerated on the federal and local levels. There is a lot of double counting. SCAAP does not count all illegal immigrants. The non-illegal immigrant number is a combination of legal immigrants and native-born Americans, which makes the latter look more peaceful and the former more dangerous than they really are. These figures underestimate the incarceration rates for illegal immigrants and non-illegal immigrants.
Figure 1: Illegal Immigrants and Non-Illegal Immigrant SCAAP-Adjusted Incarceration Rates, Per 100,000
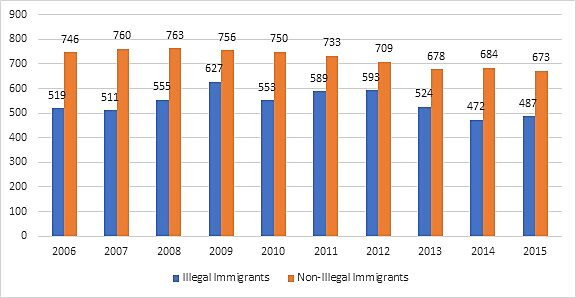
Sources: Bureau of Justice Statistics, American Community Survey, and the Department of Homeland Security.
Note: The per 100,000 is for each subpopulation.
The SCAAP figures are not refined enough to use for estimating an illegal immigrant incarceration rate because there is not a good enough denominator available. However, using the best data and methods available still shows that the nation-wide incarceration rate for SCAAP aliens is below that of non-illegal immigrants – which includes native-born Americans and legal immigrants. FAIR’s report is a prime example of poor scholarship, but the authors are only partly to blame. The lack of adequate crime and incarceration data make such desperate attempts tempting.
