Washington Post fact checker Glenn Kessler gives Senator Rand Paul Three Pinocchios for making the following claim on TV:
Ronald Reagan … said we’re going to dramatically cut tax rates. And guess what? More revenue came in, but tens of millions of jobs were created.
Before examining whether or not “more revenue came in,” consider just how dramatic the Reagan-era tax changes really were. Under the first bill in 1981, all personal tax rates were eventually reduced by 23%. But it is often forgotten that these rate reductions in were foolishly delayed until 1984. By then, however, the 49% tax bracket was down to 38%, the 24% rate to 18% and the 14% rate to 11%.
When the 1986 Tax Reform took effect in 1988, higher marginal tax rates fell further to 28–33% for those previously in tax brackets of 38–50%. The corporate tax was cut from 46% to 34%. After being reduced to 20% from 1982–86, however, the top capital gains tax was raised to 28% in 1987 before being rolled-back to 20% in 1997 and 15% in 2003.
Mr. Kessler mainly takes issue with Senator Paul’s comment that “more revenue came in” after the highest marginal tax rates on income or capital gains were reduced (I’ll deal with jobs issue in a separate blog).
Before considering his evidence, take a close look at the graph below — which compares reductions in top tax rates for personal income and taxable capital gains with the growth of real federal tax revenues, measured in 2009 dollars.
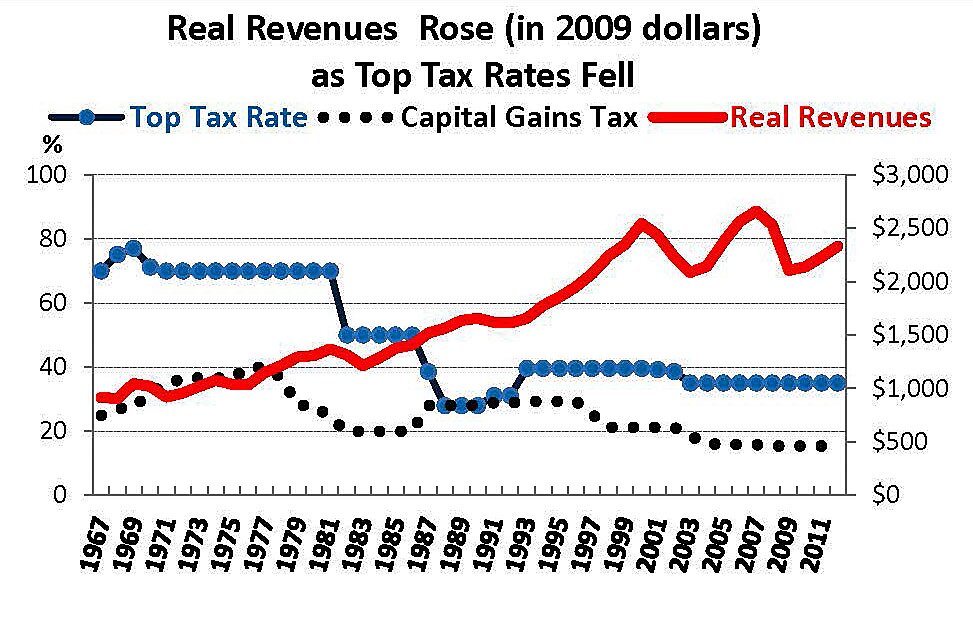
Aside from cyclical revenue losses in the aftermath of recessions (1982–3, 2001–2, 2008-10), it appears undeniable that real revenues grew most briskly after top tax rates were reduced, including reduced tax rates on capital gains in 1978, 1997 and 2003. By contrast, real revenues were flat or down during years of high tax rates on income and/or capital gains, such as 1969–77. Although early years are not shown in this graph, real revenues were actually lower in 1961 than in 1952 — a period with 91% tax rates and three recessions.
The graph stops with 2012 because fiscal 2013 includes the fourth quarter of 2012 when taxpayers realized gains and collected bonuses to avoid Obama’s higher tax rates. Thomas Piketty and Emmanuel Saez report that income reported by the Top 1% fell by 14.9% in 2013 when top tax rates on income and capital gains were increased. “The fall in top incomes in 2013 is due to the 2013 increase in top tax rates,” notes Saez.
Mr. Kessler does not actually deny that “more revenue came in” after tax rates were reduced in 1984 and 1988, even though he accuses Senator Rand of lying about that. Kessler instead tries to attribute much of the (unmentioned) 1981–90 revenue increase to badly-estimated “tax increases” in 1982, 1983, 1984 and 1987. Those tax laws mainly involved in reneging on promises to further accelerate business depreciation in 1984–85, not changes in rates. The 1983 law raised the Social Security tax rate one percentage point, but not until 1988–90.
Kessler also changes the subject from growth of revenue over time to revenues as percentage of GDP. He says, “revenues as a percentage of gross domestic product (GDP), which is the best way to compare across years, dropped from [a record high of] 19.1 percent in 1981 to a low of 16.9 percent in 1984, before rebounding slightly to 17.8 percent in 1989.” Far from being “the best way” to discover whether or not “more revenue came in,” revenues as a percentage of GDP tell us almost nothing about that. The only two times revenues hit 19% of GDP — in 1969 and 1981 — the economy and revenues promptly collapsed under that burden.
Kessler then confuses old revenue estimates with actual revenue. He says, “the Treasury Department in 2006 confirmed that tax cuts reduced revenue.” That is untrue – at least three Pinnochios untrue.
The author of that brief 2006 Treasury memo, Jerry Tempalski, simply compiled original static estimates from the Treasury, JCT or “statements or tables included in the Congressional Record without a citation for the source of the estimates.” Tempalski warns that such revenue estimates “do not take into account the effect of the bills on GDP, even though some bills … were primarily designed to stimulate the economy.” He also admits that he made “no adjustment for estimates that proved to be inaccurate.” In other words, Kessler’s alleged proof is just a list of antique estimates — some from unknown sources, some known to be wrong, and none of them extending beyond four years.
According to an updated version of this so-called Treasury Department study, the 1964 Kennedy tax cuts, which took rates down from 20–91% to 14–70%, were estimated to lose the equivalent of $64 billion in 2009 dollars. On the contrary, federal revenues in 2009 dollars soared from $710 billion in 1963 to $914 billion in 1967 – an awesome gain of 28.8% in just four years. Similar vintage estimates for rate reductions in 1984–88 are no more credible today than those absurdly erroneous estimates of 1964.
Measured in 2009 dollars, real federal revenues rose from $1.37 billion in 1981 to $1.64 billion by 1990 – a 21.3% gain. President Reagan left office in January 1989 but his tax rates lasted another year. Top tax rates were then increased in 1991 and 1993, but real federal revenues in 1993 were no higher than in 1990 when the top tax rate was 28%. As a share of GDP, revenues were 17.8% in 1989 but remained well below that level until 1995. Revenues again reached 17.9% of GDP in 2007 (despite some revenue-losing 2001-03 tax breaks), but only14.9% from 2009 to 2012.
The usual cheerleaders for Carter-era tax rates jumped on Twitter with shouts of “Voodoo!” and “Smoke and Mirrors” when Washington Post writer Glenn Kessler awarded Rand Paul Three Pinnochios for telling the truth about tax revenues rising from 1981 to 1990. It is Mr. Kessler who deserves Three Pinnochios.
