Writing in Project Syndicate, Stephen Roach, former chief economist for Morgan Stanley, declares the U.S. economy’s foundations fundamentally unsound:
“America’s net national savings rate – the sum of saving by businesses, households and the government sector – stood at just 2.1% of [gross] national income in the third quarter of 2017. That is only one third of the 6.3% of the average that prevailed in the final three decades of the twentieth century… America… is saving next to nothing. Alas, the story doesn’t end there. To finance consumption and growth, the U.S. borrows surplus saving from abroad to compensate for the domestic shortfall. All that borrowing implies a large balance of payments deficit with the rest of the world which spawns an equally large trade deficit.”
This alleged “savings crisis” has popped up periodically since the 1980s when there’s a Republican in White House, such as 2006 when I wrote about it.
Roach believes it “important to think about saving in ‘net’ terms, which excludes the depreciation of obsolete or worn-out capacity in order to assess how much the economy is putting aside to fund the expansion of productive capacity.”
Dividing net savings by gross national income subtracts a semi-arbitrary estimate of depreciation from the numerator but not from the denominator. Dividing net by gross shrinks the resulting savings/income ratio. For Roach to suggest that more net savings could in any sense pay for more “consumption and growth” is misleading at best. Don’t expect a discount on a new car because you hope to pay with net savings, after subtracting estimated depreciation.
The amount of money needed for new plants and equipment is gross, not net. And it is the dollar gap between gross investment and gross saving that needs to be financed by attracting foreign investment. Mr. Roach calls foreign investment in U.S. equity (stocks) or real property “borrowing,” but that’s not how we describe the same investments if made by a U.S. resident.
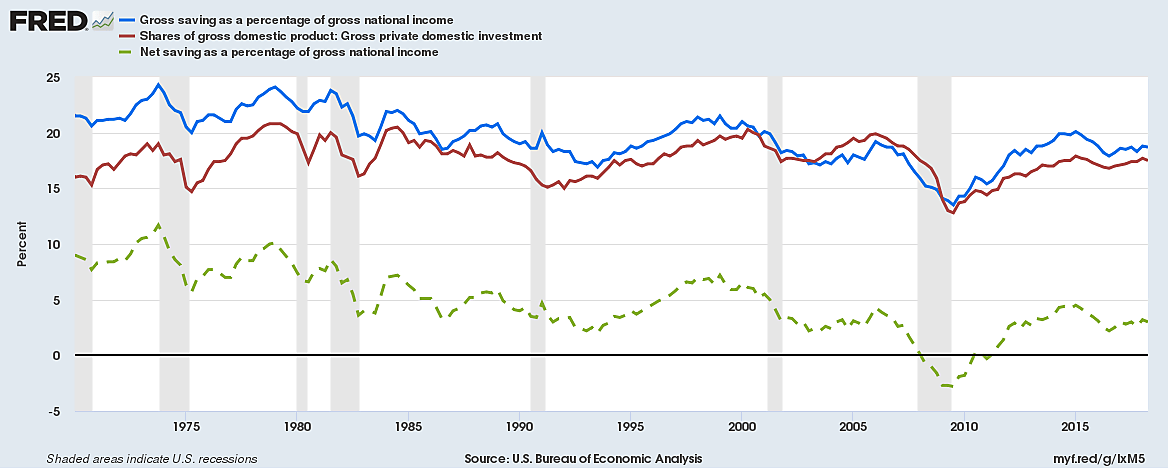
The blue line in the first graph shows gross savings as a percentage of gross national income (GNI). The red line shows gross private domestic investment as a percentage of GDP, which is quite similar to GNI (GDP excludes income of foreigners spent in the U.S. and remitted income of Americans living abroad).
The dotted green line is net savings divided by gross income – the extraneous ratio that worries Mr. Roach. The green line appears to fall much more than the blue line simply because estimated depreciation rose from 12.3% of national income in 1969 to 15.9% in 2017 — as the capital stock shifted from structures to rapidly-depreciating high-tech. Because rising depreciation estimates are subtracted from saving yet added to income, the downward tilt of the green line is exaggerated by the oddity of dividing net savings by gross income.
A declining net savings rate since the mid-1960s did not thwart fixed investment, though recessions always do. Real net domestic fixed investment nearly tripled from $379.9 billion in 1983 (in 2009 dollars) to over $1 trillion by 2005–2006, and has again been heading up since the 2008-09 recession.
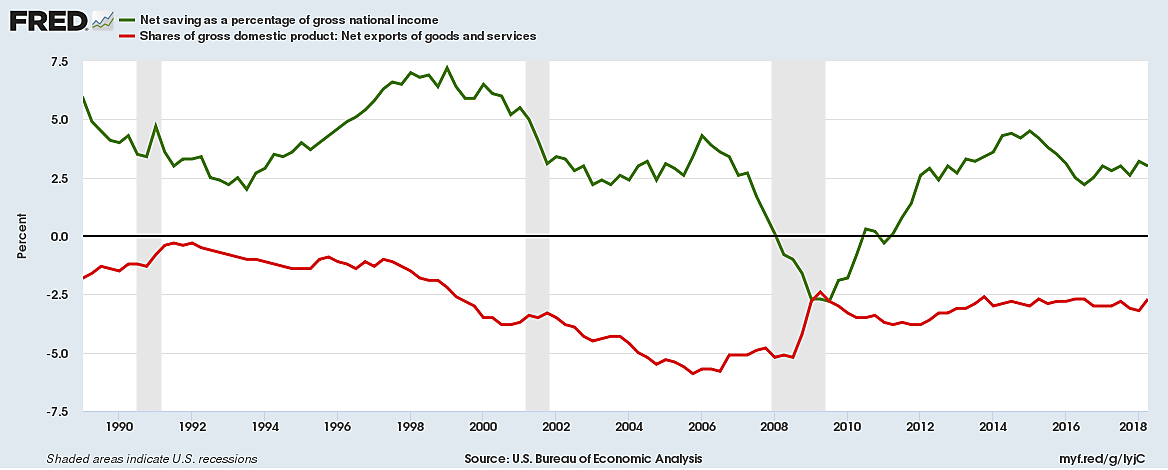
In the second graph, the ups and downs in the net savings rate (green line) do not track or explain the movements in net exports (exports minus imports). The U.S. runs a capital surplus and current account deficit when the economy is growing briskly. Trade deficits shrink just before, during and right after recessions.
When previous “net savings” anxieties appeared, they were used as a rationale for raising taxes. In accounting, unlike economics, it sounds simple to raise national savings by reducing the government’s negative savings (budget deficits). If we carelessly assume that higher taxes have no bad effects on the economy or private savings, budget deficits would then fall with higher taxes and national saving (the sum of public and private saving) would rise. In this simplistic bookkeeping, more taxes are defined as being identical to more savings.
There are big problems with assuming a $100 million tax-financed cut in the deficit equals a $100 million increase in national savings. One is that politicians’ favorite targets for new taxes are savers and savings – retained corporate profits, dividends, interest, capital gains and high incomes in general. If successful firms and families pay more in taxes, they’ll have less to save.
But the biggest problem with assuming smaller budget deficits add to national savings is that it is rarely true. Smaller deficits (particularly surpluses) are frequently offset by lower private savings.
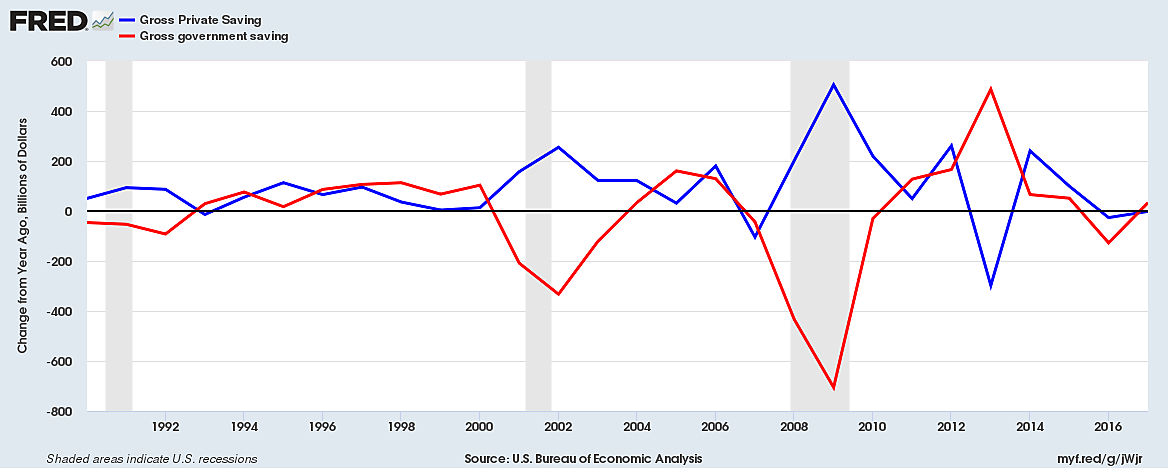
The last graph compares recent changes in government savings (red line) with changes in private saving (blue) in billions of 2009 dollars. When the red line falls sharply (2000–2002 and 2006–2009), that indicates a rising budget deficit. Each time the red line fell, however, the blue line rose nearly as much — leaving total national saving little changed. Conversely, when the deficit was greatly reduced from 2011 to 2014, private savings was greatly reduced too, with little net effect on total public and private saving.
This inverse relationship between public and private savings is not unique to the United States, nor to the last 30 years. In “A Reconstruction of Macroeconomics” (1992), I displayed graphs for the U.K., Sweden, Norway, and Japan to show the household savings rates fell dramatically (sometimes into negative territory) when these countries moved from budget deficits to surpluses for a few years in the 1978–92 period. This is consistent with Ricardian Equivalence (taxpayers regard more national debt as their own, so they save to pay more future taxes), but perhaps also consistent with simpler cyclical explanations (people save more in recessions to rebuild lost wealth, and do the opposite in boom times).
We do not live in a closed economy, where new investment might have to be financed from flows of new domestic saving rather than from stocks of appreciated assets. Global capital finds investment opportunities around the world, and foreign firms and investors find many of the best opportunities in the USA. More capital is better than less, and a dollar is a dollar.
Since the purpose of saving is to add to wealth, the best measure of saving is the addition to wealth. In the first quarter of 2018, household net worth was a record 685% of disposable income according to the Federal Reserve – up from 548% six years earlier. When the value of accumulated wealth rises that much, annual additions to the stockpile (saving) become far less urgent or significant.
Dire warnings of a looming savings crisis have been reported many, many times before, always in ways that are agitated, confused, mistaken and irrelevant.
The net savings rate does not explain or predict investment, trade deficits, interest rates, or anything else worthy of concern.
