The United States’ immigration system favors family reunification – even in the so-called employment-based categories. The family members of immigrant workers must use employment based green cards to enter the United States. Instead of a separate green card category for spouses and children, they get a green card that would otherwise go to a worker.
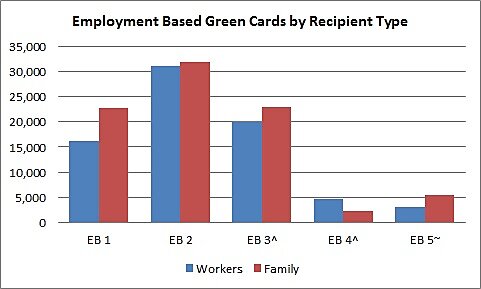
In 2013, 53 percent of all supposed employment-based green cards went to the family members of workers. The other 47 percent went to the workers themselves. Some of those family members are workers, but they should have a separate green card category or be exempted from the employment green card quota altogether.
Source: 2013 Yearbook of Immigration Statistics, Author’s Calculations
If family members were exempted from the quota or there was a separate green card category for them, an additional 85,232 highly skilled immigrant workers could have entered in 2013 without increasing the quota.
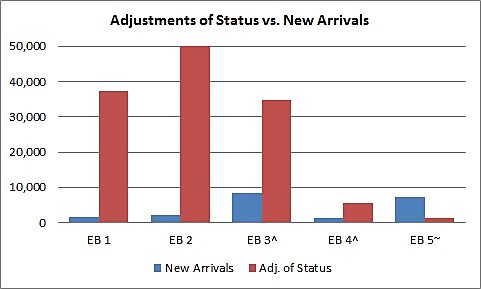
139,757 green card beneficiaries, 87 percent of those who gained an employment-based green card in 2013, were already legally living in the United States. They were able to adjust their immigration status from another type of visa, like an H‑1B or F visa, to an employment-based green card.
Source: 2013 Yearbook of Immigration Statistics, Author’s Calculations
Exempting some or all of the adjustments of status from the green card cap would almost double the number of highly skilled workers who could enter. Here are some other exemption options:
- Workers could be exempted from the cap if they have a higher level of education, like a graduate degree or a PhD.
- A certain number of workers who adjust their status could be exempted in the way the H‑1B visa exempts 20,000 graduates of American universities from the cap.
- Workers could be exempted if they show five or more years of legal employment in the United States prior to obtaining their green card.
- Workers could be exempted based on the occupation they intend to enter. This is a problem because in involves the government choosing which occupations are deserving, but so long as it leads to a general increase in the potential numbers of skilled immigrant workers without decreasing them elsewhere, the benefits will outweigh the harms.
|
2013 Employment Based Green Cards |
||||||||
| EB 1 | EB 2 | EB 3^ | EB 4^ | EB 5~ | All EB | Percent | ||
| Workers‘ |
16,225 |
31,130 |
20,034 |
4,673 |
3,102 |
75,164 |
46.86% |
|
| Workers Adjusted‘ |
15,616 |
30,484 |
17,318 |
4,247 |
592 |
68,257 |
||
| Workers New Arrivals‘ |
609 |
646 |
2,716 |
426 |
2,510 |
6,907 |
||
| Family |
22,753 |
31,896 |
22,931 |
2,246 |
5,406 |
85,232 |
53.14% |
|
| Family Adjusted |
21,667 |
30,472 |
17,403 |
1,349 |
609 |
71,500 |
||
| Family New Arrival |
1,086 |
1,424 |
5,528 |
897 |
4,797 |
13,732 |
||
| Adjustment of Status |
37,283 |
60,956 |
34,721 |
5,596 |
1,201 |
139,757 |
87.13% |
|
| New Arrival |
1,695 |
2,070 |
8,244 |
1,323 |
7,307 |
20,639 |
12.87% |
|
| Total |
38,978 |
63,026 |
42,965 |
6,919 |
8,508 |
160,396 |
||
| EB 1 | EB 2 | EB 3^ | EB 4^ | EB 5~ | ||||
| Workers Adjusted |
96.25% |
97.92% |
86.44% |
90.88% |
19.08% |
|||
| Worker New Arrivals |
3.75% |
2.08% |
13.56% |
9.12% |
80.92% |
|||
| Family Adjusted |
95.23% |
95.54% |
75.89% |
60.06% |
11.27% |
|||
| Family New Arival |
4.77% |
4.46% |
24.11% |
39.94% |
88.73% |
|||
| *Some data on spouses and children withheld. | ||||||||
| ^Some data on spouses, children, and workers withheld. | ||||||||
| ‘Investors for the EB‑5. | ||||||||
| ~Some data on spouses, children, and investors withheld. | ||||||||
| Source: 2013 Yearbook of Immigration Statistics | ||||||||


