The Federation for American Immigration Reform (FAIR) released a report claiming that E‑Verify lowered unemployment rates in states that implemented it. FAIR’s report is deeply flawed. The first section of this blog will catalog FAIR’s errors and show that states with mandatory universal E‑Verify typically had higher unemployment. The second portion of this blog will use the synthetic control method to look at E‑Verify’s effect on unemployment in Arizona after the E‑Verify mandate. The flaws in FAIR’s report are important to highlight as more states are considering a universal E‑Verify mandate. There is little evidence that E‑Verify mandates lower unemployment but much evidence that they raise it.
Criticisms of FAIR’s Report
E‑Verify is a taxpayer funded federal government run system that is supposed to exclude illegal immigrants from the workforce. The system would be used at the point of hire to verify that any new worker is actually authorized to work in the United States. FAIR attempted to show that states with E‑Verify have higher employment growth relative to other states. This is likely an attempt to overcome one of the stronger criticisms of E‑Verify: It is an expensive labor market regulation that will increase unemployment by raising the cost of hiring new workers among other problems. However, FAIR excluded the first state to mandate E‑Verify and made numerous other silly methodological choices that make their results unreliable.
First, the FAIR authors excluded Arizona from their report. Arizona was the first state to mandate E‑Verify for all new hires. Unemployment rates as measured by U3 were lower in Arizona than in the rest of the United States prior to the implementation of E‑Verify and they shot up afterward, remaining consistently above the rest of the United States (Figure 1). The result is even more extreme for the U6 unemployment rate that the FAIR report insisted on using (Figure 2). Narrowing the comparison to the southwestern states of California, Colorado, Nevada, New Mexico, Oklahoma, Texas, and Utah shows similar results whereby Arizona had relatively lower unemployment prior to mandating E‑Verify and higher unemployment afterward (Figures 3–4). Utah mandated E‑Verify for some employers during this time but excluding that state does not affect the results. Mandatory E‑Verify did not appear to improve employment in Arizona.
Figure 1
Arizona Unemployment Rate (U3) vs. United States Unemployment Rate (U3)
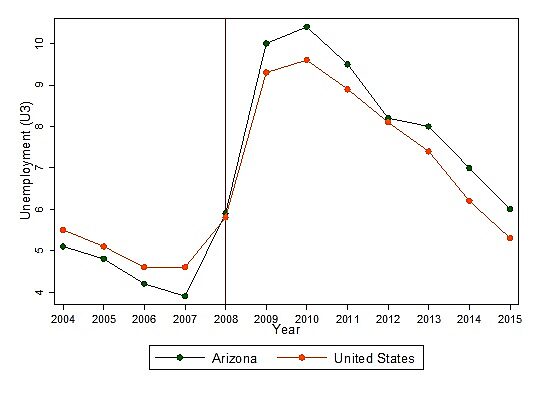
Source: Bureau of Labor Statistics.
Figure 2
Arizona Unemployment Rate (U6) vs. United States Unemployment Rate (U6)
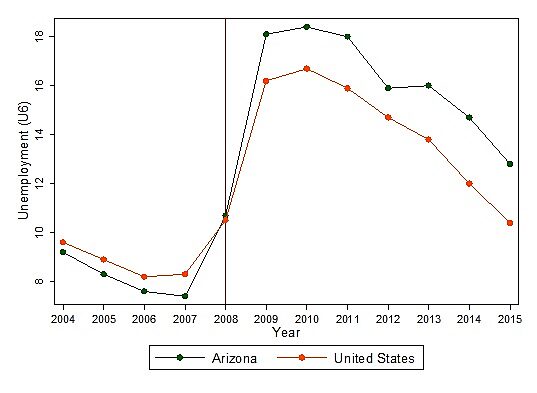
Source: Bureau of Labor Statistics.
Figure 3
Arizona unemployment Rate (U3) vs. Southwest Unemployment Rate (U3)
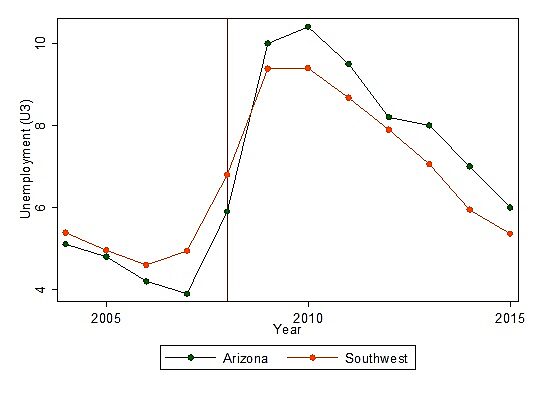
Source: Bureau of Labor Statistics.
Figure 4
Arizona Unemployment Rate (U6) vs. Southwest Unemployment Rate (U6)
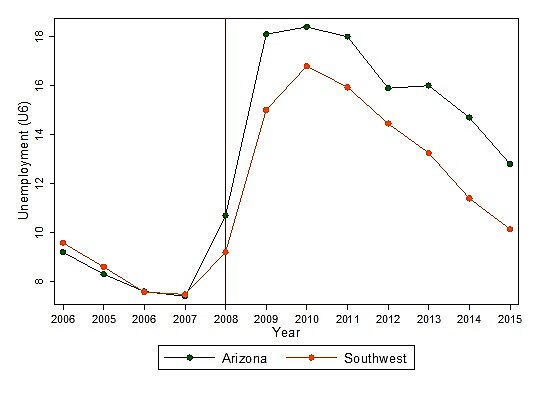
Source: Bureau of Labor Statistics.
Second, FAIR did not distinguish between different types of E‑Verify mandates. They treated West Virginia’s law that the “West Virginia Legislature requires any employer that has employees working on the grounds or in buildings of the Capitol Complex, or who have access to sensitive or critical information, to use E‑Verify” with being as strict as Alabama’s statewide mandatory E‑Verify requirement for all new private and public sector hires. Those different laws are going to have different impacts so it makes no sense for FAIR to treat them as the same. This blog only looks at states with universal E‑Verify mandates because that is FAIR’s policy goal.
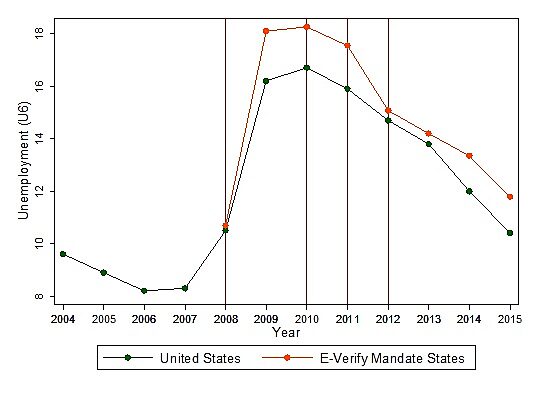
Third, FAIR did not show an average effect across states with mandatory universal E‑Verify. I constructed a simple average of U6 unemployment in all states (Arizona, Alabama, Mississippi, and South Carolina) for each year they had a universal E‑Verify mandate and compare them to states that did not (Figure 5). States are added to the average when they passed new mandates. The vertical lines show when each state passed its E‑Verify mandate. States with an E‑Verify mandate had consistently higher unemployment than states that did not. This does not mean that E‑Verify caused the persistently higher unemployment rates in these states as these state governments might have passed E‑Verify because of high unemployment rates. However, this simple analysis does provide evidence that states with E‑Verify mandates did not then have lower unemployment rates than other states.
Figure 5
E‑Verify Mandate States Unemployment Rate (U6) vs. United States Unemployment Rate (U3)
Source: Bureau of Labor Statistics.
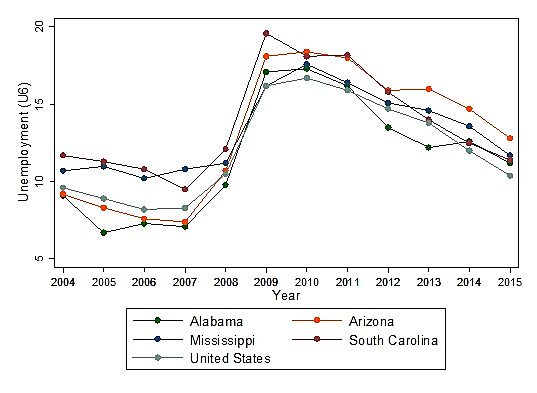
Fourth, there were an estimated 350,000 unauthorized immigrants living in Arizona in 2009. In the same year, there were only 210,000 illegal immigrants living in all of Alabama, Mississippi, and South Carolina. If E‑Verify were to have an effect on unemployment then it would be most obvious is Arizona. However, it is impossible to tell when each state enacted mandatory E‑Verify by eyeballing the U6 rate (Figure 6). The state of the economy drives the unemployment trends more than this labor market regulation. If E‑Verify has an effect, it is small.
Figure 6
Unemployment Rates (U6) by State and Nationwide
Source: Bureau of Labor Statistics.
There are at least two reasons why the E‑Verify mandate did not much affect the unemployment rates in these states. First, illegal immigrant workers were small fractions of the workforce in three-quarters of them. Second, E‑Verify’s effect is attenuated because many employers in these states do not follow the E‑Verify mandates and it is ineffective at actually excluding illegal immigrant workers even when it is used properly.
Fifth, the FAIR report analyzed a period of time that coincided with recovery from the Great Recession. In other words, FAIR chose a start date for its report after which nationwide unemployment rates were guaranteed to fall. The authors of the FAIR report made no effort to correct for that huge confounding factor.
Synthetic Controls Method
This section uses the synthetic controls method (SCM) to see how E‑Verify affected relative unemployment in states that mandated the program. SCM “allows for effect estimation in settings where a single unit (a state, country, firm, etc.) is exposed to an event or intervention. It provides a data-driven procedure to construct synthetic control units based on a convex combination of comparison units that approximate the characteristics of the unit that is exposed to the intervention. A combination of comparison units often provides a better comparison for the unit exposed to the intervention than any comparison unit alone.” SCM creates an alternative version of the unit that was not affected by the intervention based on numerous indicator variables for other units prior to the intervention. Researchers use the SCM widely.
The comparison units are states that must be similar to Arizona prior to the passage of mandatory E‑Verify which I track back to 2004 (other papers have gone back to 1998). Furthermore, the indicator variables must also be related to unemployment. I chose states in the American southwest and indicator variables of the state level minimum wage laws, population, the percent of the population that are illegal immigrants, the state unionization rate, and per capita GDP. SCM shows that Arizona’s unemployment rate rises above what it would have been in Arizona without E‑Verify (Figure 7). This means that E‑Verify is likely the cause of the increase in relative unemployment in Arizona since its mandate.
The Root Mean Square Percentage Error (RMSPE) measures how close the pre-E-Verify Real Arizona is to the pre-E-Verify Synthetic Arizona Without E‑Verify and the closer it is to zero (but not too close), the better it is. The RMSPE is an excellent 0.0504892. The Synthetic Arizona without E‑Verify is constructed from 33.9 percent of Nevada, 29.1 percent New Mexico, 20.9 percent Texas, and 16.1 percent Utah. The indicator variables are 16.7 percent the Arizona U3 unemployment rate in 2007, 28.7 percent the population of the states, 14.4 percent the state’s minimum wage, 9.2 percent the state’s population who are illegal immigrants, a fraction of a percent from the unionization rate, and 31 percent from the state’s GDP per capita. These are good weights distributed over many indicator variables. When I excluded states with a partial E‑Verify mandate on firms by certain sizes (Georgia, North Carolina, Tennessee, and Utah), the results were very similar.
Figure 7
Synthetic Control Method Arizona, U3 Unemployment Rate
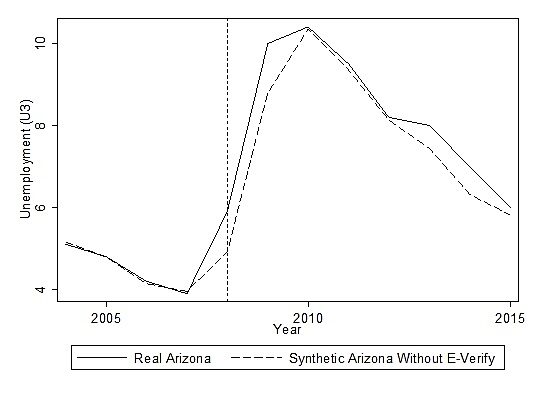
Sources: Bureau of Labor Statistics, Bureau of Economic Analysis, Eren and Ozbeklik, American Community Survey, and Pew.
I then ran two robustness checks to see how much confidence we should have in these findings. The first is called an in-time placebo and it changes the date of E‑Verify’s enactment to see if there was a similar effect. If there was a similar effect in other years then E‑Verify is less likely to be the culprit. However, there was not a similar effect for other years which should increase confidence in the original SCM finding that E‑Verify increases unemployment.
The second robustness check is called an in-place placebo and it runs the SCM for every single state to see if Arizona stands out (Figure 8). Arizona is in the bolded green line and it does not stand out relative to other states in the southwest. This robustness check should decrease our confidence that E‑Verify had much of an impact on the unemployment rate in either direction because Arizona straddles the horizontal 0 line. A quick use of the SCM over these years with these indicator variables cannot show that E‑Verify increased unemployment in Arizona but it does show that E‑Verify did not lower unemployment.
Figure 8
In-Place Placebo, U3 Unemployment Rate
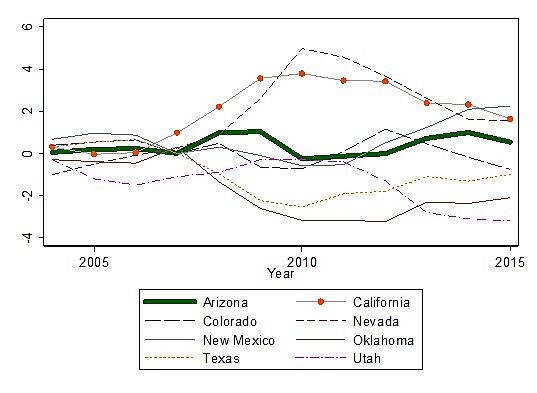
Sources: Bureau of Labor Statistics, Bureau of Economic Analysis, Eren and Ozbeklik, American Community Survey, and Pew.
This wonderful paper by Magnus Lofstrom, Sarah Bohn, and Steven Raphael at the PPIC uses different indicator variables over a different period and finds a negative employment effect from E‑Verify. I trust their more thorough review of the evidence than my own but I needed to run my own simpler SCM here in order to look at the same years analyzed by FAIR.
Conclusion
FAIR’s report made several questionable methodological choices in analyzing how E‑Verify affects unemployment rates on the state level. Most egregiously, FAIR excluded Arizona even though it was the first state to mandate universal E‑Verify. Any thorough and reputable study on the employment effects of E‑Verify must include all of the states that actually mandated it. Furthermore, unemployment rates in states with universal mandatory E‑Verify were mostly higher than in other states. Lastly, I used the synthetic control method to show that Arizona’s unemployment rate did not drop as a result of E‑Verify and there is some evidence that E‑Verify even increased unemployment in Arizona. Whatever one can say about E‑Verify, it does not lower unemployment rates.
