Illegal immigrants who can’t work are more likely to commit crimes in order to support themselves, according to a superb new paper by Matthew Freedman, Emily Owens, and Sarah Bohn that is forthcoming in the American Economic Journal: Economic Policy. They examined administrative data from Bexar County, Texas and found an increase in felony charges filed against residents who were most likely to be illegal immigrants after the Immigration Reform and Control Act made it unlawful for illegal immigrants to work in the United States.
Their finding is especially relevant for the current debate over E‑Verify, an electronic eligibility for employment verification system that is supposed to exclude illegal immigrants from the workforce. The goal of E‑Verify is to turn off the wage magnet that attracts illegal immigrants to the United States and open up jobs for American workers. Although E‑Verify fails to lower unemployment and only has a very small effect on dimming the wage magnet, the paper by Freedman et al. points to another possible unintended consequence of mandating E‑Verify: higher crime.
Arizona provides a wonderful opportunity to test whether an E‑Verify mandate affected crime. In March 2007, the Arizona House passed the Legal Arizona Workers Act (LAWA). The state Senate passed it in May and governor Napolitano signed it in July. Among other things, LAWA mandated E‑Verify for all new employees beginning on January 1, 2008.
We used Arizona Department of Corrections (ADC) data on the number of entries into the prison system by month by citizenship. The ADC data does not allow us to separate prisons by nativity or legal immigration status so we used the proxy of non-citizens, many of whom are likely illegal immigrants and would be affected by mandatory E‑Verify. Although this is a grave imperfection in the data that makes us hesitant to continue, the effect we find is large enough to report in the hopes that future researchers will be able to actually identify illegal immigrants who are incarcerated. We interpolated Arizona population data to the monthly level using a cubic spline to better capture any non-linearity in population trends.
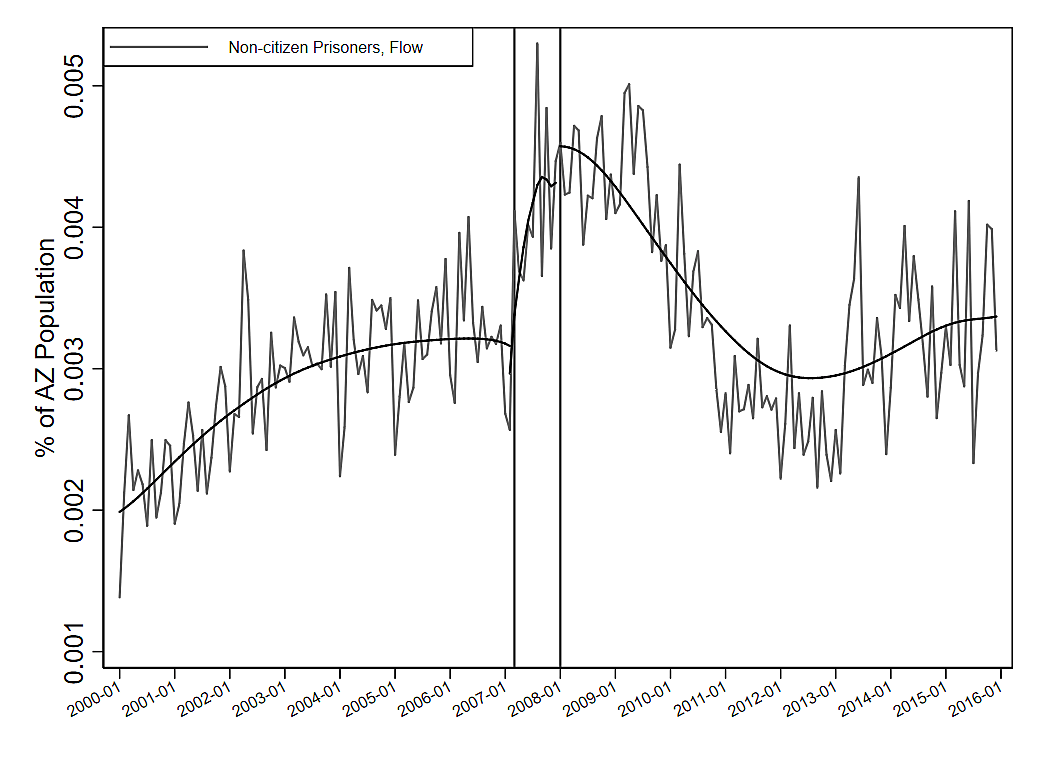
First, we consider the flow of non-citizens into Arizona prisons as a fraction of the Arizona population multiplied by 100. The vertical bars correspond to March 2007 and January 2008 when E‑Verify first passed the Arizona House and was effective, respectively. To smooth trends in this series, we overlay a locally weighted polynomial regression line computed for three periods: before E‑Verify passed the House, after E‑Verify passed the House and before its implementation, and after the E‑Verify mandate took effect.[1] There is a significant discontinuity and uptick in the flow of non-citizens into Arizona prisons relative to the total population after E‑Verify passed in March 2007 up until it became mandatory in January 2008 (Figure 1).
Figure 1
Monthly Flow of Non-Citizens into Arizona Prisons
Source: Authors’ interpretation of Arizona Department of Corrections data.
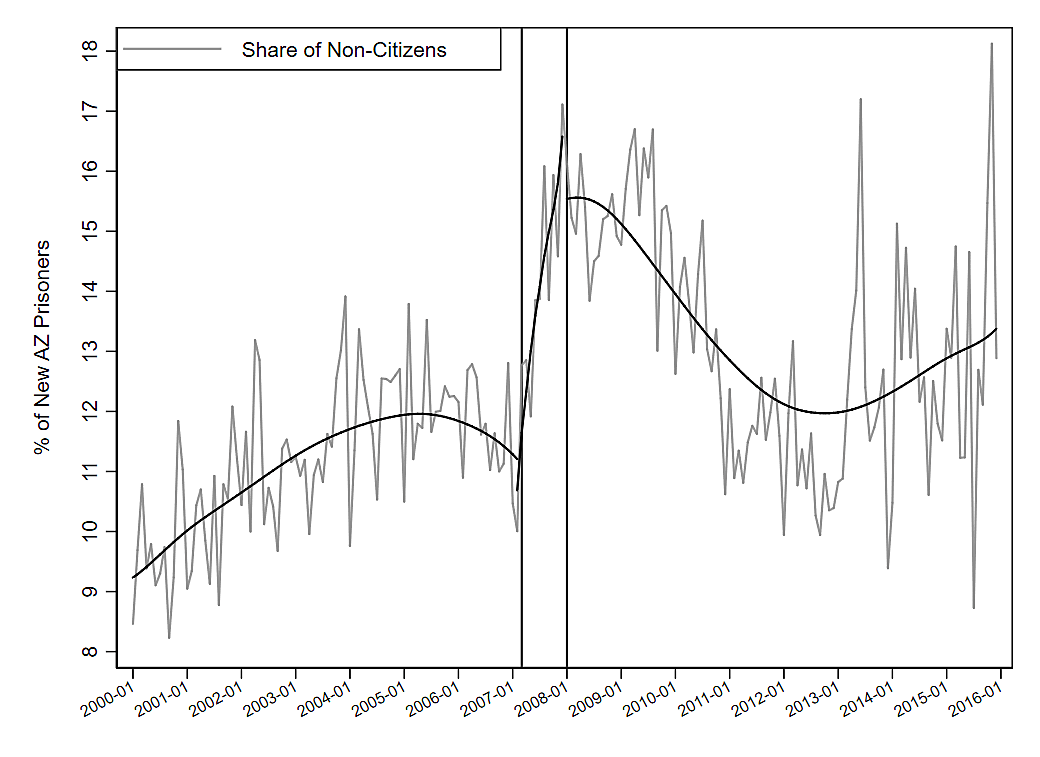
Figure 2 shows a sharp increase in the share of non-citizen entries into Arizona prisons relative to all new entries after E‑Verify laws were passed. To determine whether these relations are simply due to chance, we also consider a simple regression model with controls for other state-level economic factors.
Figure 2
Monthly Share of Non-Citizen Admissions into Arizona Prisons as a Percentage of All Admissions
Source: Authors’ interpretation of Arizona Department of Corrections data.
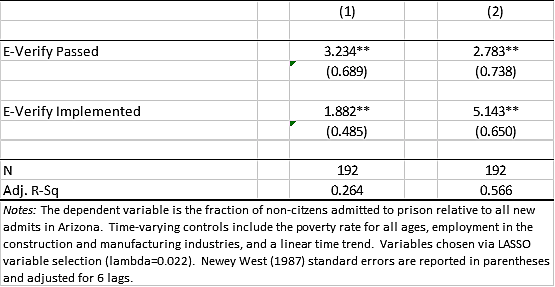
In order to add a regression to our suggestive graphs, we created indicator variables denoting the level of E‑Verify law activation with one variable for the period after the law was passed and before its activation and one after E‑Verify was activated. This allowed us to examine both the reaction to the LAWA’s passage and what happened when it took effect. Results for this specification indicate a statistically significant change in the average flow of non-citizens to Arizona prisons by approximately 3.2 percent after passage and 1.9 percent after implementation (Table 1, Column 1). Since the series are likely to be serially autocorrelated, we compute Newey-West (1987) standard errors corrected for six lags of autocorrelation for each specification.
To control for variation in prisoner flows based on economic factors, we collect employment and unemployment data from the Bureau of Labor Statistics, median income and poverty rates from the Census Bureau’s Small Area Income and Poverty Estimates program, and personal income from the Bureau of Economic Analysis.[2] Since many of these variables are likely to be highly correlated, we employ a Lasso regression framework to identify and remove redundant regressors.[3] Results for this model with Lasso-selected covariates are in Column 2 of Table 1 and show a similar pattern of significant increases in the share of non-citizen flows into Arizona prisons of nearly 2.8 percent after E‑Verify passed and 5.1 percent after it went into effect.
Table 1
Effect of E‑Verify on the Share of Non-Citizen Prisoner Admission in Arizona State Prisons
These relatively simple graphs and regressions do not provide evidence that E‑Verify boosted the inflow of non-citizen prisoners into Arizona prisons. However, they do show a clear, significant, and positive association between an E‑Verify mandate and the fraction of non-citizens sent to prions in Arizona. Other social scientists should take the research by Freedman et al. seriously and view state-wide E‑Verify mandates as an opportunity to study how increased immigration enforcement affects crime. The supporters of E‑Verify should also consider that one possible result of mandating that system is higher incarceration and crime rates.
Andrew Forrester contributed mightily to the econometric portions of this post.
[1] We choose a bandwidth of 0.8 based on visual appearance of fit to the data series.
[2] Data for personal income, poverty rates, and median income were only available at the quarterly and yearly level and were interpolated to the monthly level using a cubic spline.
[3] For details on this procedure, see Belloni et al. (2014).


