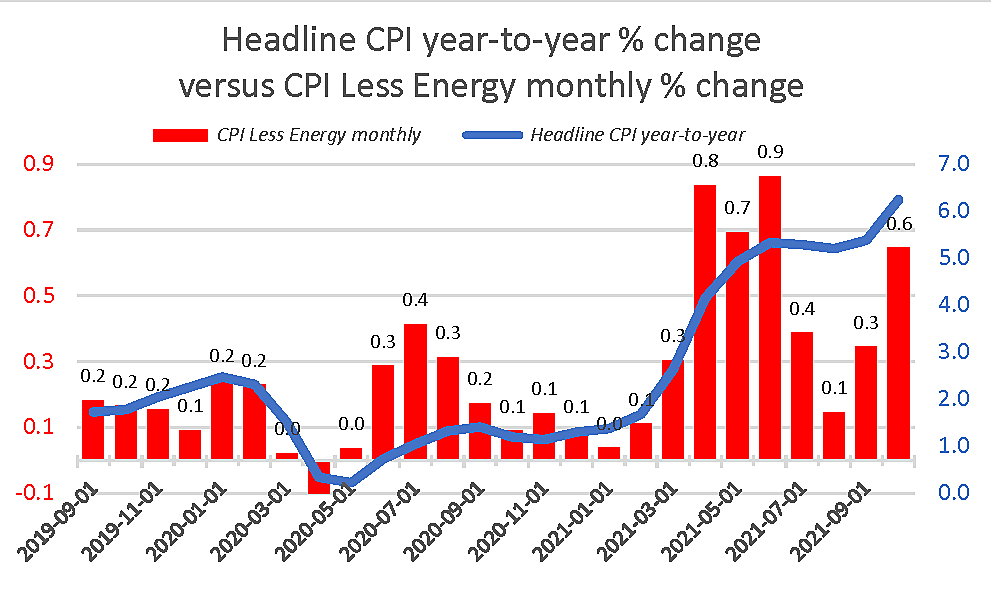
This graph compares the year-to-year percentage change in headline inflation (the blue line) with the monthly percentage change in the consumer price index (CPI) excluding energy (the red bars). Because the blue line has exceeded 5% since June and exceeded 6% in October, many are understandably convinced that inflation was lower in the spring and has accelerated since then.
As I recently demonstrated, however, large year-to-year percentage changes in the overall CPI have always been dominated by huge changes (both up and down) in the world price of crude oil.
One way to partly correct for the distortion caused by oil price swings is to use the CPI excluding energy and look at in real-time rather than compared with 12 months ago. This is not a perfect solution because oil prices have powerful indirect effects on many goods (such as plastics) and services (transportation) that are still included in the CPI that excludes consumer energy prices per se.
The red bars show that monthly changes in ex-energy consumer prices rose very rapidly in April, May, June, and, to a lesser extent, also October. Unlike the blue line, however, they show no monthly acceleration since June. The bars and the line convey quite different messages about the recent direction of inflation (though both are worrisome).
Why should we exclude or ignore the doubling of crude oil prices over the past 12 months when trying to predict what may happen to prices in general over the next 12 months? The main reason is that it won’t happen again. Oil prices have never doubled for two years in a row, and they often fall as fast as they rose. Of all the price increases in any consumer or producer price index, none are so obviously “transitory” as a 108% 12-month rise in crude oil.
We can be confident that this key element of past inflation will not keep rising nearly as quickly it did after the low 2020 base period of globally depressed sales and prices during the severe COVID-19 outbreak from October 2020 to February 2021. To maintain a similar pace of overall inflation from this point forward, several other important prices would have to rise faster to offset slow (or negative) increases in year-to-year oil prices.
The other reason to not use the broad energy-inclusive CPI to predict 12-month inflation rates is that next April, May, and June the 12-month percentage changes will be calculated from this spring’s high base. That high base will have the opposite effect of misusing the low 2020 base this September and October.
If conservative media keeps highlighting year-to-year changes as if that tells us what happened last month, those now shouting about the 6.4% figure as the latest measure of inflation may well be obliged to make the opposite mistake next spring and say that inflation is coming down — even if it isn’t.