Voters in Massachusetts, Georgia, Illinois, and elsewhere are being treated to a little 2012 redux, as desperate candidates try to paint their opponents with last election’s popular pejorative: “Outsourcer!” You may recall the accusations exchanged between President Obama and Mitt Romney two years ago, as each sought to portray the other as more guilty of perpetuating the “scourge” of outsourcing. At the time, I faulted Romney for running away from what I thought was his responsibility (as the businessman in the race) to explain why companies outsource in the first place, and how doing so benefits the economy and leads to better public policies. Had he done so, his explanation might have sounded something like this.
For many people, the term outsourcing evokes factories shuttering in the industrial midwest only to be ressurrected in Mexico or China to produce the exact same output for export back to the United States. While a popular image of outsourcing, that particular rationale — to produce for export back to the United States — accounts for less than 10 percent of the value of U.S. direct investment abroad (as this paper describes in some detail). Over 90 percent of outward FDI is for the purpose of serving foreign goods and services markets and for performing value-added activities in conjunction with transnational production and supply chains. In most industries, it is difficult to succeed in foreign markets without some presence in those markets. And without success in foreign markets (where 95% of the world’s consumer’s reside), it is more difficult to succeed at home.
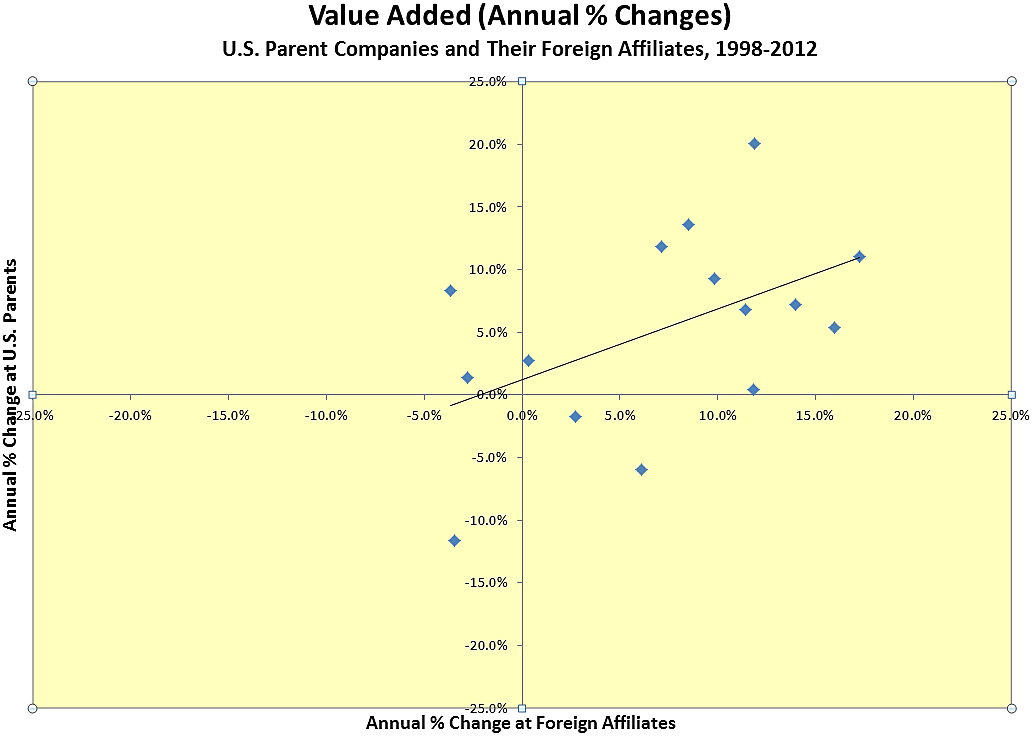
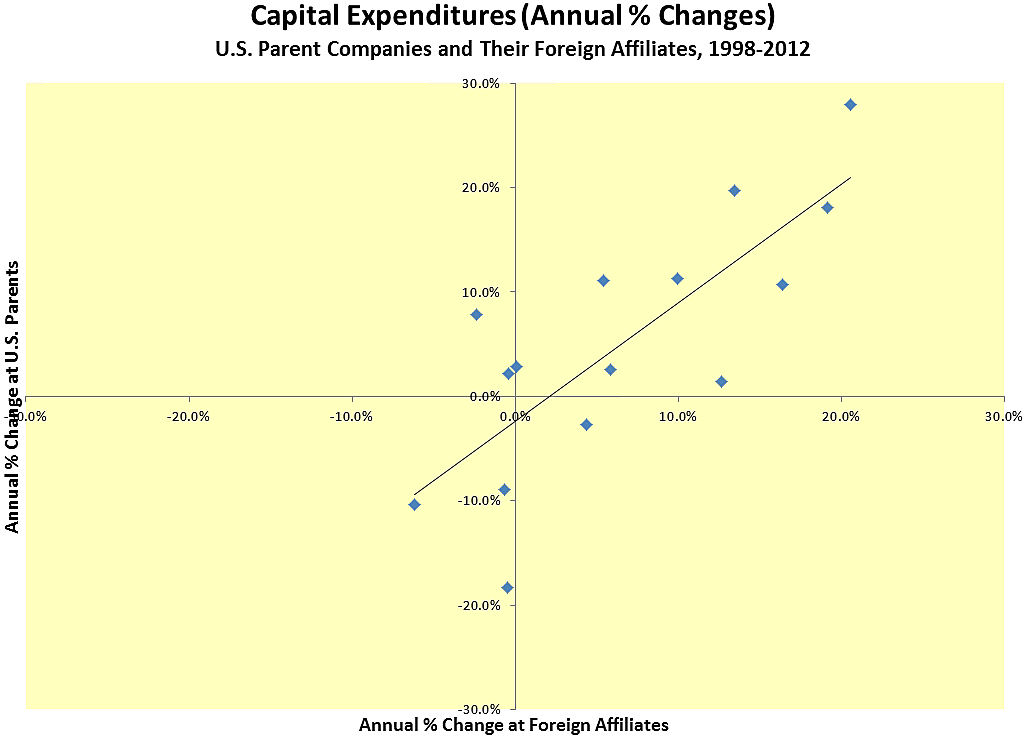
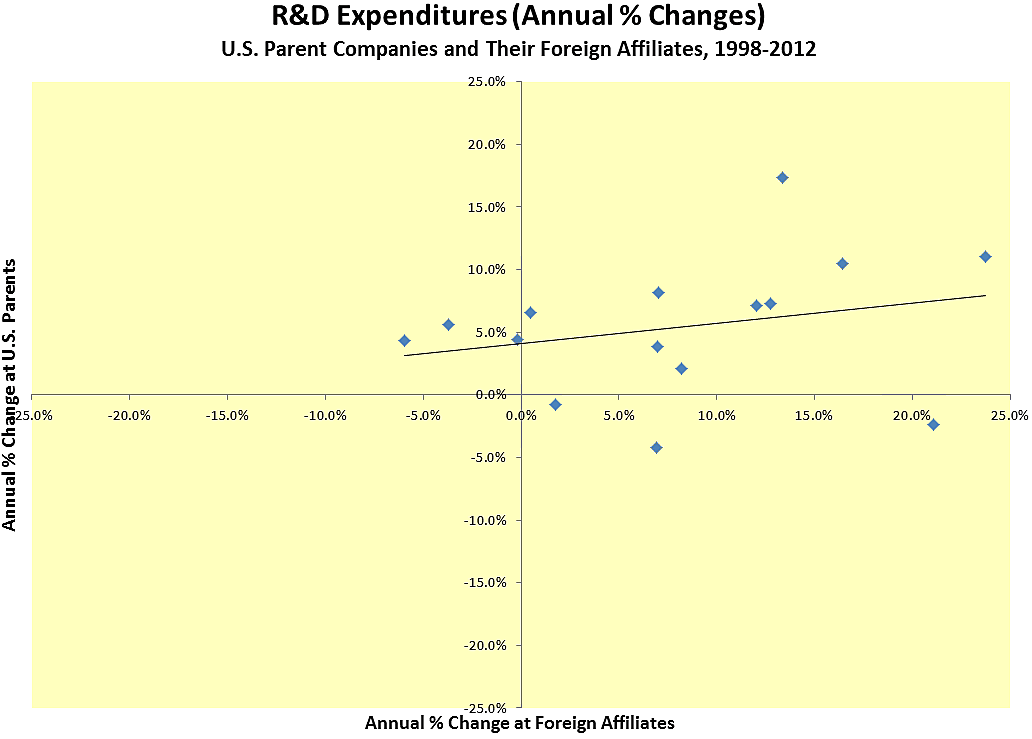
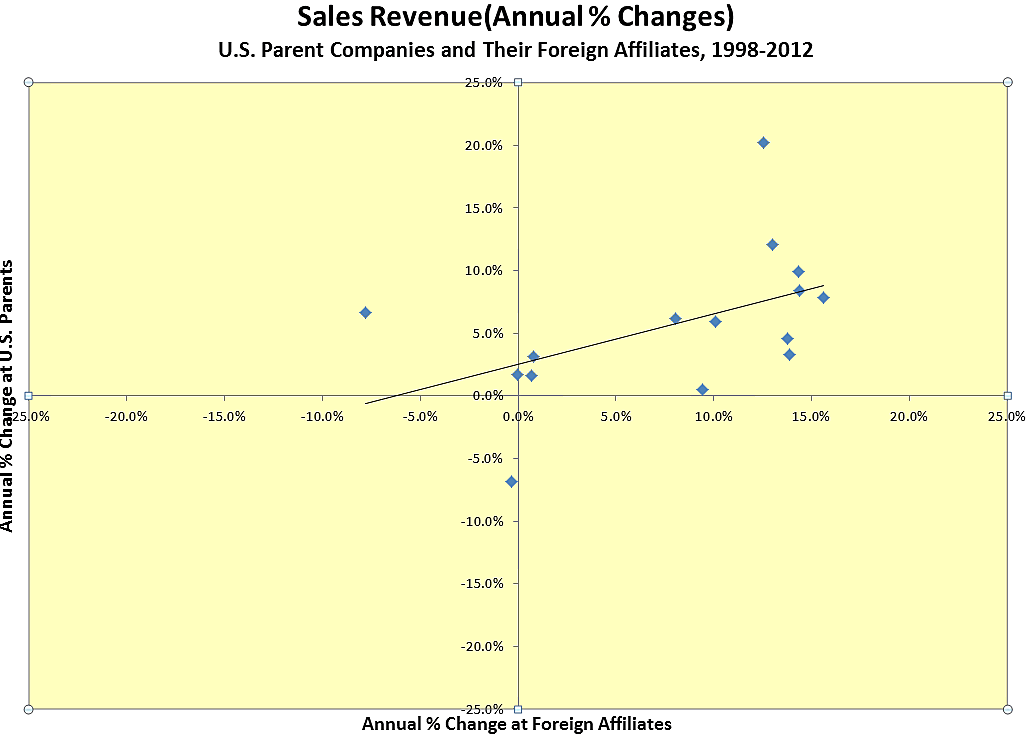
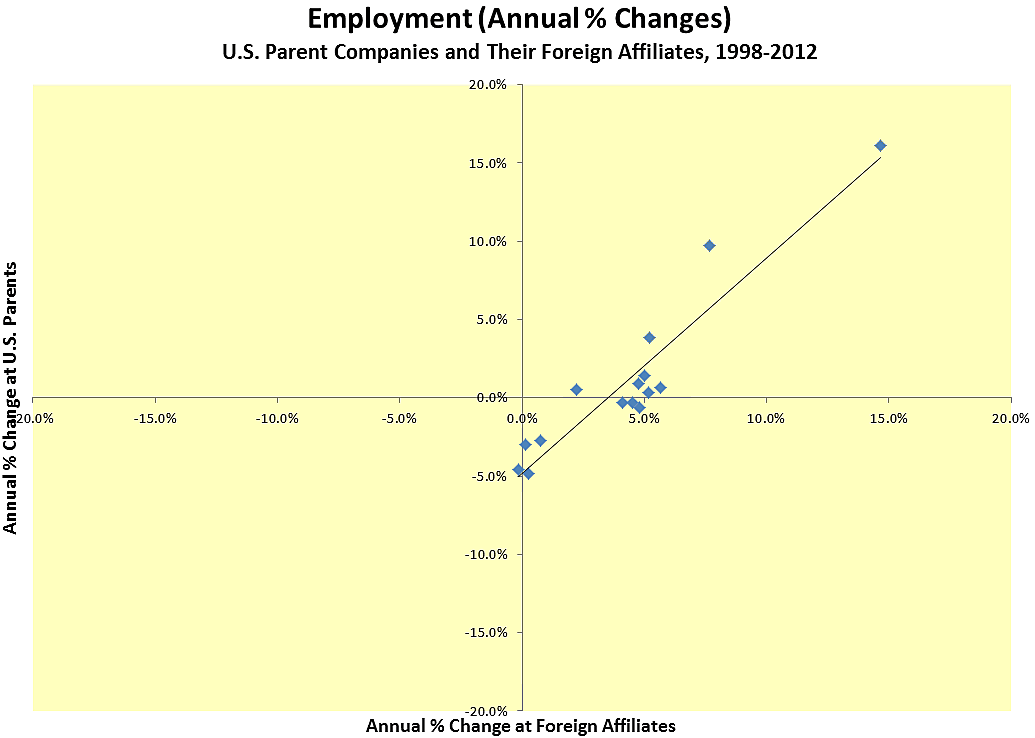
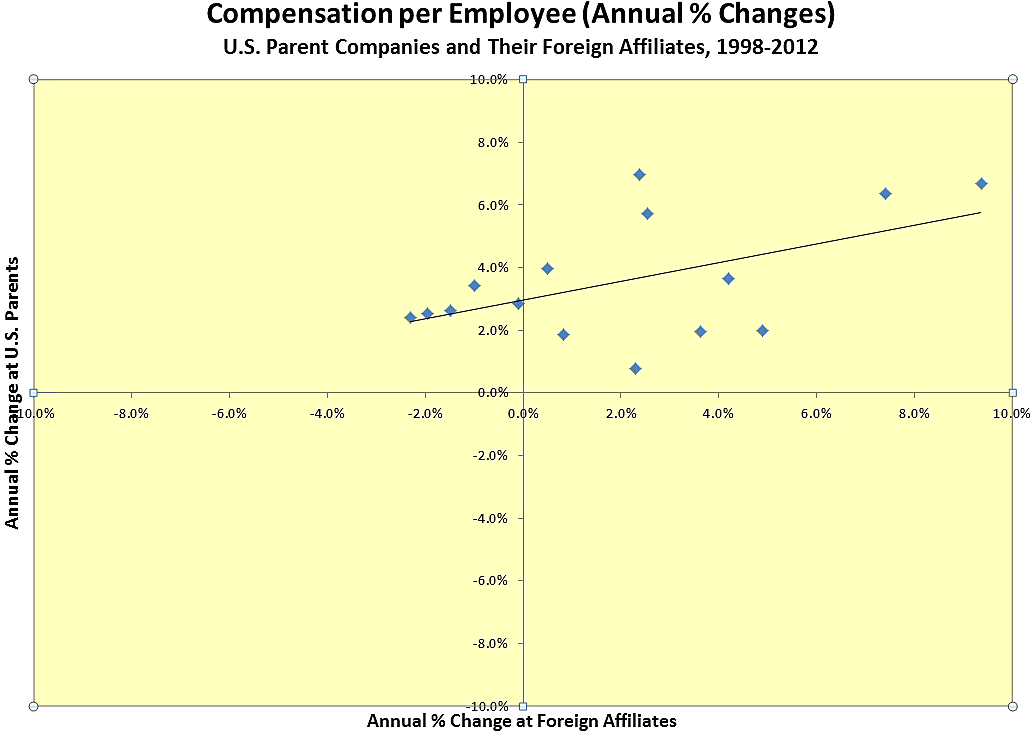
So, does “outsourcing” really deserve its bad reputation? Does it really hurt the U.S. economy? Well, the U.S. Bureau of Economic Analysis collects and compiles the kinds of data that can help us begin to answer these questions, including data about inward and outward foreign direct investment, and the activities of U.S. multinational corporations — both U.S. parents companies and their foreign subsidiaries. The scatterplots presented below reflect the relationships between annual changes in various performance metrics (value added, capital expenditures, R&D expenditures, sales revenues, employment, and compensation per employee) experienced by U.S. parent companies and their foreign affiliates. Each point on each plot represents a combination of the annual percent change for the affiliate (horizontal axis) and the parent (vertical axis) in a given year.
If a foreign hire comes at the expense of a U.S. job, if ramping up production abroad means curtailing output at home, if a $100 million investment in a new production line or research center abroad means that plans for a new line or center in the United States get scrapped, if foreign outsourcing is as bad as its critics suggest, then we should expect to see an inverse relationship (at least not a direct or positive relationship) between the economic activities at U.S. parents and their foreign affiliates. We should expect to see most of the points in the upper-left or lower-right quadrants of the plots below.
The first plot shows annual changes in value added. The prevalance of observations in the upper-right quadrant indicates that in most years, value-added increased at foreign affiliates and their U.S. parents simultaneously, suggesting that U.S. and foreign activities of U.S. multinational are complements, not substitutes. That might be counterintuitive for some, but those more familiar with how multinational corporations operate can probably appreciate that production and sales activity on the foreign affiliates end often requires support from the parent company with respect to the provision of goods, supply chain logistics, finance, accounting, public relations, and various administrative functions. Increased activity abroad necessitates increased activity at home. Granted, the slope of the line running through those points is less than 45 degrees, which suggests slightly less than a one percent increase in value added at U.S. parents for every one percent increase of value added at their foreign affiliates. But this picture clearly refutes the notion of a zero-sum game, as value added increased for one group and decreased for the other in only 4 or 15 years.
The concern that U.S. MNC investment in factories or research centers abroad diverts investment from their U.S. operations should be put to rest by the data in the capital expenditures chart below. The positive relationship between capital expenditures abroad and at home is very strong, moving in the same direction for 12 of 15 years at approximately the same rate (the slope of the line is about 45%).
Claims that outsourcing drains research and development dollars and activities from the United States get a little bit of support from the data below (6 years showing an inverse relationship and a slope suggesting a ratio of about a 5 percent increase at foreign affiliates for every one percent increase at parents). However, in 9 of 15 years, R&D expenditures increased at both affiliates and parents, suggesting that research and development spending is also complementary.
In 13 of 15 years, annual changes in sales revenue moved in the same direction — and positively for both affiliates and parents in 12 of those 13 years. These data suggest that sales by affiliates do not come at the expense of parents’ sales.
The idea that outsourcing amounts to “shipping jobs overseas” is not well supported by the employment figures, which indicate that in 9 of 15 years, employment changes moved in the same direction at parents and affiliates.
Finally, the compensation data also fail to support the negative characterizations associated with outsourcing. In 10 of 15 years, changes in the amount of compensation per worker moved in the same direction and, in fact, never once showed a decrease at U.S. parents.
Certainly, there are more data to consider and more layers of analysis to perform, but the metrics considered here suggest a lack of merit to to the adverse connections politicians, in particular, make between outsourcing and domestic economic conditions.
