“Consumer prices rose at the fastest pace in 30 years for September” according to a Wall Street Journal feature about the price index for personal consumption expenditures (PCE). At first glance, that sounds even scarier than equally misleading reports about the same month’s consumer price index (CPI) hitting a 13 year high. Both claims were based on comparing the level of prices with those of September 2020, not changes over the past six months.
Claiming the PCE index of consumer prices “rose at the fastest pace in 30 years” sounds as if prices in rose in September at a faster rate than in any other month for the past 30 years, and certainly faster than any other month this year. Yet the article later mentions that “the index was up 0.3% in September from the previous month. Excluding food and energy categories [the core PCE] … the index rose 0.2%.” Those modest increases were back down the January lows, and far below the March to August monthly average of 0.5% increases for both headline and core inflation.
The genuinely interesting inflation news went unreported. It is that the Fed’s favorite core PCE inflation has slowed every month for five months: 0.62% in April, 0.59% in May, 0.48% in June, 0.34% in July, 0.26% in August and 0.21% in September. Rather than hitting a record 30-year high in September, core inflation in September was at a six-month low.
If we include energy and food prices (which is inadvisable), PCE inflation just slowed more gradually – from 0.54% in June to 0.41% in July, 0.34% in August and 0.32% September. Headline inflation declined more gradually than core inflation because of rising oil prices. The monthly PCE index for energy prices rose by 1.51% in June, 1.65% in July, 1.93% in August and 1.29% in September.
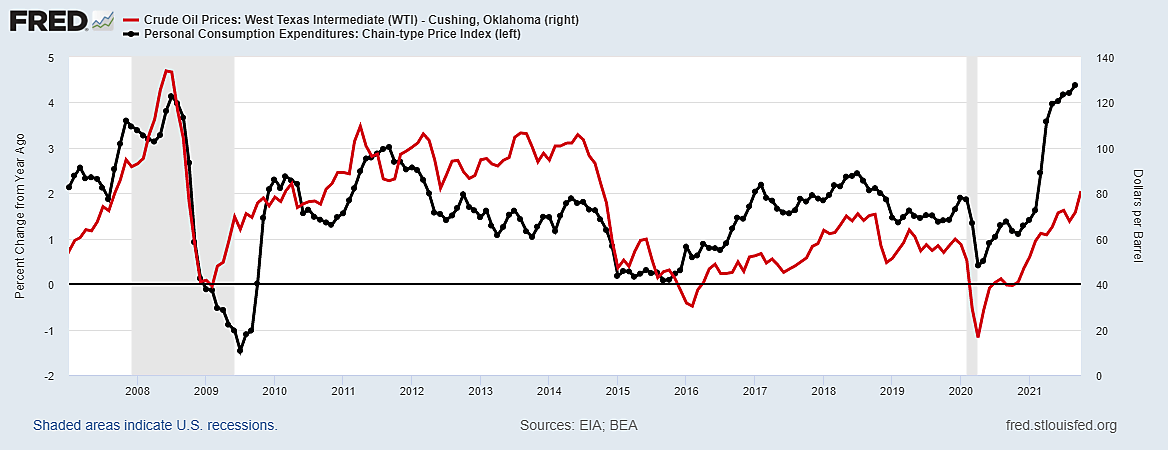
The first graph shows why oil price gyrations (the red line) make monthly core inflation much more trustworthy than year-to-year changes in the total PCE index. The price of a barrel of West Texas crude doubled from $67.49 in June 2007 to $133.88 in June 2008, pushing the year-to-year PCE inflation (the black line) up from 2.1% to 3.8%. But the world economy collapsed under the weight of brutal energy costs, so that by February 2009, the worldwide economic collapse pushed Texas crude down to $39.09. Cutting oil prices by nearly $100 left the dubious year-to-year PCE inflation below zero (-1.5%).
The global oil shock of 2008 was labeled The Great Recession but it was nothing new. Nearly all postwar U.S. recessions followed big oil price shocks. But a 1997 study by Ben Bernanke and two others argued this may have been because “a number of the most significant tightenings of US monetary policy have followed on the heels of major increases in the price of imported oil.”
It is critically important to understand that the 13-year gap between 2008 and 2021 spikes in year-to-year headline inflation simply mirrors the fact that year-to-year crude oil prices doubled in both years. If the Fed now disregards rising world oil prices since May—by ignoring year-to-year changes and focusing on the 5‑month slowdown of core inflation—the U.S. need not stumble into another Fed-engineered plan to chase rising oil prices with rising interest rates.
The Wall Street Journal claim of the fastest inflation in 30 years was about a 4.4% change from September 2020 to September 2020 which, the author opined, “could force the central bank to raise interest rates to keep price in check.” But the Fed surely recalls how the media in 2008 also confused the last doubling of oil prices with year-to-year inflation. The Fed must also be aware that this September’s 12-month average was still dominated by high monthly inflation from April to June – shown as red bars on the second graph. And the Fed presumably knows that core inflation has slowed for five months.
A newer Wall Street Journal article speaks of “stubbornly high” inflation. Since May, the author explains, “12-month price changes have been holding near 30-year highs.” Yet monthly price changes have been slowing since May.
The trouble is that 12-month price changes are always stubbornly slow to move with recent inflation reports, particularly when oil prices are rising. The 12-month change tells you much more about how low prices were 12 months ago (especially oil prices), and about high inflation was this Spring, than it does about what happened in the last few months.
The popular fixation on year-to-year comparisons is especially unhelpful in late 2021 because a year ago the global pandemic set off a deflationary global going-out-of-business sale. Many liquidation prices dropped below costs, so they had to rise. Pandemic inflation in the U.S. fell from 0.31% in August 2020 to 0.16% in September, then zero in October and November. Year-to-year percentage changes this September-November are automatically boosted by being calculated from a base of low pandemic prices. And year-to-year changes next Spring will be automatically lessened by being calculated as changes from the inflated prices this March-June.
The blue bars in the second graph show that in 2020, year-to-year changes were also extremely slow to reflect current information about slowing inflation. The red bars—depicting monthly PCE inflation at a compound annual rate—slowed from 6% in May 2020 to zero by November, yet the year-to-year measure paradoxically implied inflation was higher last November than it was in May. When inflation then sped up a bit last Winter, the blue year-to-year change kept showing stubbornly low inflation through March 2021 – the most inflationary month of the year.
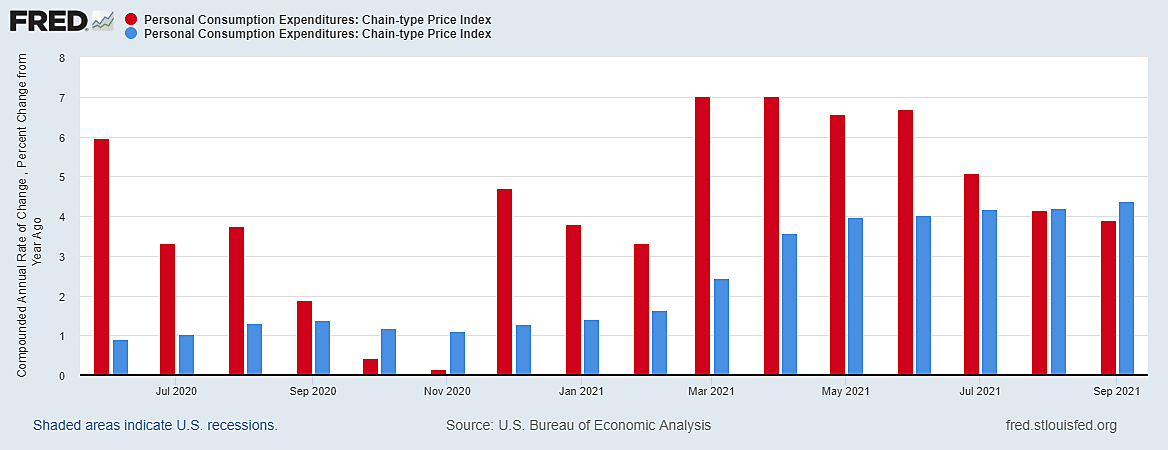
In the past six months, the red bars show overall PCE inflation (not core inflation) slowing from an annual rate of 7% in March and April to 3.9% this September. Yet the year-to-year measure is being reported, ironically, as having more than doubled since March to reach a 30-year high. Year-to-year changes in inflation have been completely uninformative when inflation was speeding up or slowing down, often signaling in the wrong direction.
The recent claim that PCE inflation just hit a 30-year high is sure to be echoed repeatedly by conservative media in support of policy concerns I share, like the stagflationary risk of runaway federal spending and the endless Fed bond-buying spree. But worthy causes do not justify bad data. I cannot condone abusing inflation statistics – even to support such vital issues as fiscal frugality and monetary stability.
Oil and energy prices have risen in recent months, but core inflation has slowed continually for five months. Inflation is still too high, but it has been slowing in recent months – not rising to new record heights.
