Global Science Report is a weekly feature from the Center for the Study of Science, where we highlight one or two important new items in the scientific literature or the popular media. For broader and more technical perspectives, consult our monthly “Current Wisdom.”
—
First China. Now the U.S.
It was big news last November when it was revealed that China had been under-reporting its coal consumption by nearly 20 percent. The big implication was that China’s greenhouse gas emissions were also much larger than being reported, complicating the (then) upcoming U.N. climate negotiations in Paris.
Now comes evidence that the U.S. has been underreporting its methane emissions—a potent greenhouse gas—by some 50 percent or more. And what’s worse, is that over the past decade or so, instead of methane emissions having declined by about 10 percent as reported by the EPA, they have in fact grown by more than a whopping 30 percent. Not only would this information also have (had it been available) complicated the U.N. Paris talks, but it would have taken a lot of the shine off the U.S. emissions reduction efforts that President Obama was touting at the conference last December.
The new evidence is presented in a just-published paper in the scientific journal Geophysical Research Letters by a team led by Harvard PhD candidate Alexander Turner. Turner and colleagues examined several measures of methane emissions occurring in the U.S. (including in situ measurements and remote satellite observations) and concluded that EPA estimates were way off. They wrote:
National inventory estimates from the US Environmental Protection Agency (EPA) indicate no significant trend in US anthropogenic methane emissions from 2002 to present. Here we use satellite retrievals and surface observations of atmospheric methane to suggest that US methane emissions have increased by more than 30% over the 2002–2014 period… This large increase in US methane emissions could account for 30–60% of the global growth of atmospheric methane seen in the past decade.
The implications are huge—at least when it comes to our advertised role as a supposed leader in climate change mitigation efforts.
Consider this soaring rhetoric from the President in his opening remarks to the U.N.’s Paris climate conference last December:
I’ve come here personally, as the leader of the world’s largest economy and the second-largest emitter, to say that the United States of America not only recognizes our role in creating this problem, we embrace our responsibility to do something about it.
Over the last seven years, we’ve made ambitious investments in clean energy, and ambitious reductions in our carbon emissions. We’ve multiplied wind power threefold, and solar power more than twentyfold, helping create parts of America where these clean power sources are finally cheaper than dirtier, conventional power. We’ve invested in energy efficiency in every way imaginable. We’ve said no to infrastructure that would pull high-carbon fossil fuels from the ground, and we’ve said yes to the first-ever set of national standards limiting the amount of carbon pollution our power plants can release into the sky.
The advances we’ve made have helped drive our economic output to all-time highs, and drive our carbon pollution to its lowest levels in nearly two decades…
For our part, America is on track to reach the emissions targets that I set six years ago in Copenhagen — we will reduce our carbon emissions in the range of 17 percent below 2005 levels by 2020. And that’s why, last year, I set a new target: America will reduce our emissions 26 to 28 percent below 2005 levels within 10 years from now.
In light of the data contained within the new Turner et al. report, Obama’s statements about greenhouse gas emissions are wrong.
Here’s why.
EPA reports that methane emissions are about 25 times more potent than the equivalent amount of carbon dioxide emissions and when taking that into account, methane emissions make up about 10 percent of the total of all U.S. greenhouse gas emissions.
The EPA also thinks methane emission have been on the decline:
Methane (CH4) emissions in the United States decreased by almost 15% between 1990 and 2013. During this time period, emissions increased from sources associated with agricultural activities, while emissions decreased from sources associated with the exploration and production of natural gas and petroleum products.
But the Turner team’s new evidence is that the emissions of this potent greenhouse gas have been rapidly rising—contrary to the EPA claims (Figure 1).
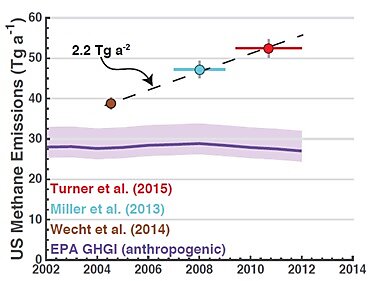
Figure 1. U.S. methane emissions according to EPA and three other studies (figure adapted from Turner et al., 2016).
A significant and sizeable change such as this in the trajectory of the second most prevalent greenhouse gas emitted in the U.S. has implications on the overall trajectory of the sum total of all U.S. greenhouse gas emissions.
Figure 2 shows the impact. In the left hand-panel are the EPA’s numbers for all greenhouse gas emissions (carbon dioxide, methane, nitrous oxide, fluorinated gases), while the right-hand panel reflects the new methane numbers from Turner’s study. While the difference may not look like much, notice that the apparent decline in total emissions since 2005 is less in the right-hand panel than in the left.
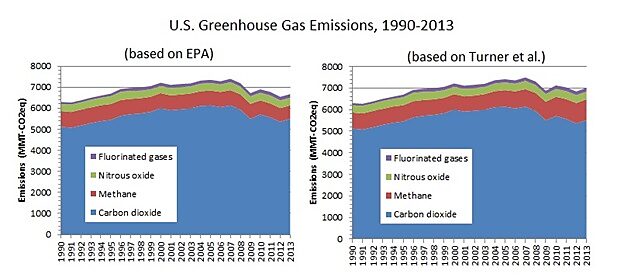
Figure 2. U.S. greenhouse gas emissions, 1990–2013. Left-hand chart shows data for greenhouse gas according to EPA; right-hand chart same as left-hand except that methane data derived from Turner et al. is included (data source: EPA).
Figure 3 shows the post-2005 evolution of total U.S. greenhouse gas emissions in greater detail. Also included in Figure 3 are the promised targets that President Obama made at the U.N.’s Copenhagen climate conference in 2009 (a reduction of 17% below 2005 emissions by 2020) and last December in Paris (a reduction of 26–28% below 2005 total by 2025).
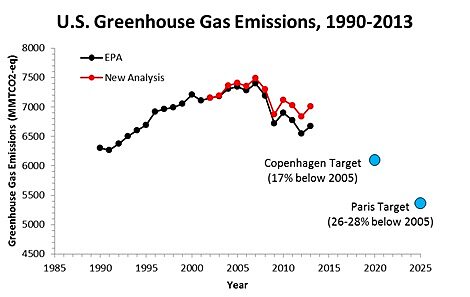
Figure3. Total greenhouse gas emissions from the U.S. from 1990–2013 according to data form the EPA (in black) and modified to account for methane emissions reported in Turner et al. (in red). Also included are the Copenhagen and Paris targets promised by president Obama (in blue).
[Note: What’s not included in Figure 3 are numbers for U.S. greenhouse gas emissions totals from 2014 and 2015 because the EPA hasn’t included them in their database yet. However, indications are that 2014 emissions were higher than 2013 emissions and that 2015 emissions were about equivalent to 2014 numbers.]
From the data behind Figure 3, we can reassess the EPA’s claim that “Greenhouse gas emissions in 2013 were 9 percent below 2005 levels.” What we find instead, using the new data, is that greenhouse gas emissions in 2013 were just 5 percent beneath 2005. Conservatively assuming that the emissions from 2014 and 2015 were the same as in 2013, then this leaves only 5 years to drop our national emissions another 12 percent. Fat chance.
And just last week a new analysis showed that there was no way that the U.S. was going to reach its Paris promised goal of reducing GHG emissions by 26–28 beneath 2005 numbers by 2025 without additional strong measures (measures that don’t seem to be in the cards)—even with some creative accounting and overly hopeful assumptions. The Supreme Court’s stay of the Clean Power Plan most certainly didn’t help the situation.
Now, with the new data from Turner and colleagues, it looks like we aren’t going to have to wait to 2025 to witness the failure, it’ll be plainly evident by 2020 (if it’s not already).
As to what may be behind the apparent strong growth in U.S. methane emissions in recent years, the Turner author offers:
The increase is largest in the central part of the country. The US has seen a 20% increase in oil and gas production and a 9‑fold increase in shale gas production from 2002 to 2014 but the spatial pattern of the methane increase seen by GOSAT does not clearly point to these sources. More work is needed to attribute the observed increase to specific sources.
The last sentence is rather telling as it seems to indicate the authors are trying to blame fracking, but just haven’t done enough work to do so at this time.
Considering that the EPA contends that methane “emissions decreased from sources associated with the exploration and production of natural gas and petroleum products,” it’ll be interesting to see how this plays out.
But two things are for sure; 1) its hard to grow the economy and reduce greenhouse gas emissions, and 2) U.S. claims to have made great strides in doing so are on shaky ground.
Obama’s can burnish our “leadership role” as climate do-gooders as much as he wants, but the facts are telling a different story—a story which may prove the undoing of his U.N. climate promises.
Reference:
Turner, A.J., et al., 2016. A large increase in US methane emissions over the past decade inferred from satellite data and surface observations. Geophysical Research Letters, doi: 10.1002/2016GL067987.
