The headlines from today’s employment report certainly seem positive.
The unemployment rate has dropped to 6.3 percent and there are about 280,000 new jobs.*
But if you dig into the details of the latest numbers from the Bureau of Labor Statistics, you find some less-than-exciting data.
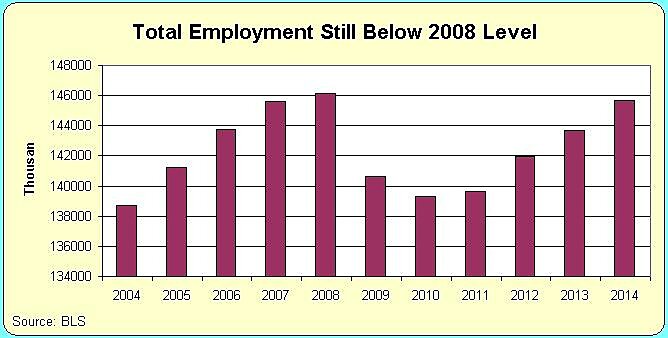
First, here is the chart showing total employment over the past 10 years.
This shows a positive trend, and it is good that the number of jobs is climbing rather than falling.
But it’s disappointing that we still haven’t passed where we were in 2008.
Indeed, the current recovery is miserable and lags way behind the average of previous recoveries.
But the really disappointing news can be found by examining the data on how many working-age people are productively employed.
The Bureau of Labor Statistics has two different data sets that measure the number of people working as a share of the population.
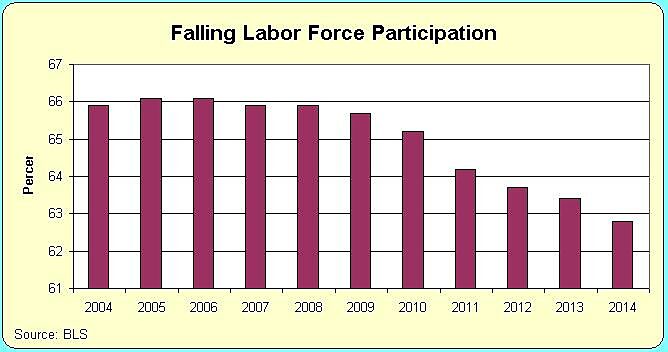
Here are the numbers on the labor force participation rate.
As you can see, we fell down a hill back in 2008 and there’s been no recovery.
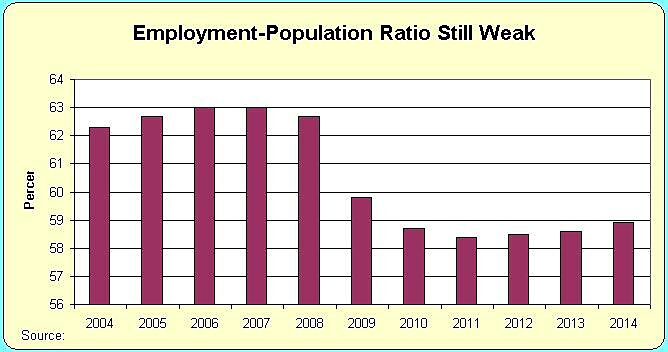
The same is true for the employment-population ratio, which is the data I prefer for boring, technical reasons.
Though I should acknowledge that the employment-population ratio does show a modest uptick, so perhaps there is a glimmer of good news over the past few years.
But it’s still very disappointing that this number hasn’t bounced back since our economic output is a function of how much labor and capital are productively utilized.
In other words, the official unemployment rate could drop to 4 percent and the economy would be dismal if that number improved for the wrong reason.
* Perhaps the semi-decent numbers from last month are tied to the fact that Congress finally stopped extending subsidies paid to people for staying unemployed?


