The Current Wisdom is a series of monthly posts in which Senior Fellow Patrick J. Michaels reviews interesting items on global warming in the scientific literature that may not have received the media attention that they deserved, or have been misinterpreted in the popular press.
The Current Wisdom only comments on science appearing in the refereed, peer-reviewed literature, or that has been peer-screened prior to presentation at a scientific congress.
***********
It seems like everyone, from exalted climate scientists to late-night amateur tweeters, can get a bit over-excited about short-term fluctuations, reading into them deep cosmic and political meaning, when they are likely the statistical hiccups of our mathematically surly atmosphere.
There’s been some major errors in forecasts of recent trends. Perhaps the most famous were made by NASA’s James Hansen in 1988, who overestimated warming between then and now by a whopping 40% or so.
But it is easy to get snookered by short-term fluctuations. As shown in Figure 1, it is quite obvious that there has been virtually no net change in temperature since 1997, allowing for the fact that measurement errors in global average surface temperature are easily a tenth of a degree or more. (The magnitude of those errors will be considered in a future Current Wisdom).
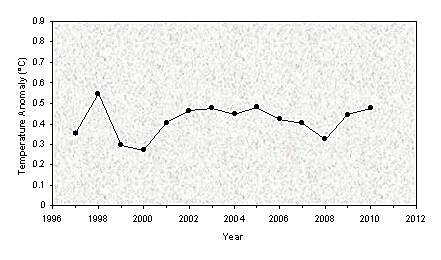
Figure 1. Annual global average surface temperature anomaly (°C), 1997–2010 (data source: Hadley Center).
Some who are concerned about environmental regulation without good science have seized upon this 13-year stretch as “proof” that there is no such thing as global warming driven by carbon dioxide. More on that at the end of this Wisdom.
Similarly, periods of seemingly rapid warming can prompt scientists to see changes where there aren’t any.
Consider a landmark paper published in 2000 in Geophysical Research Letters by Tom Karl, a prominent researcher who is the head of our National Climatic Data Center (NCDC) and who just finished a stint as President of the American Meteorological Society. He couldn’t resist the climatic blip that was occurred prior to the current stagnation of warming, namely the very warm episode of the late 1990s.
Cooler heads at the time noted that it was an artifact of the great El Nino of 1997–98, a periodic warming of the tropical Pacific that has been coming and going for millions of years.
Nonetheless, the paper was published and accompanied by a flashy press release titled “Global warming may be accelerating.”
What Karl did was to examine the 16 consecutive months of record-high temperatures (beginning in May, 1997) and to calculate the chance that this could happen, given the fairly pokey warming rate—approximately 0.17°C (0.31°F) per decade, that was occurring. He concluded there was less than a five percent probability, unless the warming rate had suddenly increased.
From the press release:
Karl and colleagues conclude that there is only a small chance that the string of record high temperatures in 1997–98 was simply an unusual event, rather than a change point, the start of a new and faster ongoing trend.
He also gave a number: “…the probability of observing the record temperatures is more likely with high average rates of warming, around 3°C [5.4°F]/century,” which works out to 0.3°C per decade.
Our Figure 2 shows what was probabilistically forecast beginning in May, 1997, and what actually happened. Between then and now, according to this paper, global temperatures should have warmed around 0.4°C (0.7°F). The observed warming rate for the last 13.5 years—which includes the dramatically warming temperatures beginning in 1997—was a paltry 0.06°C (0.11°F) per decade.
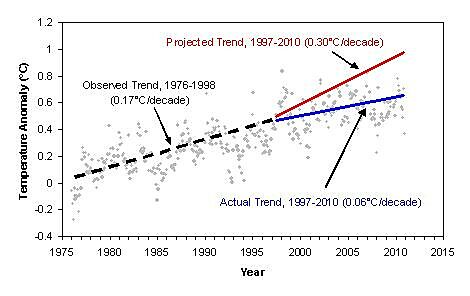
Figure 2. Prior to mid-1997, the observed warming trend (dashed line) was 0.17°/decade. Karl said there was a greater than 95% probability that 1997–8 would mark a “change point”, where warming would accelerate to around 0.30°/decade. Since then, the rate has been 0.06°/decade, or 20% of what was forecast.
Karl did provide some statistical wiggle room. While noting the less than 5% chance that the warming rate hadn’t increased, he wrote that “unusual events can occur” and that there still was a chance (given as less than 5%) that 97–98 was just a statistical hiccup, which it ultimately proved to be.
The press release couldn’t resist the “it’s worse than we thought” mindset that pervades climate science:
Since completing the research, the data for 1999 has been compiled. The researchers found that 1999 was the fifth warmest year on record, although as a La Nina year it would normally be cooler” [than what?ed].
“La Nina” is cool phase of El Nino, which drops temperatures about as much as El Nino raises them. What the press release and the GRL paper completely neglected to mention is that the great warm year of 1998 was a result of the “natural” El Nino superimposed upon the overall slight warming trend.
In other words, there was every reason to believe at that time that the anomalous temperatures were indeed a statistical blip resulting from a very high-amplitude version of a natural oscillation in the earth’s climate that occurred every few years.
Now, back to the last 13 years. The puny recent changes may also just be our atmosphere’s make-up call for the sudden warming of the late 1990s, or another hiccup.
It is characteristic for climate models whose carbon dioxide increase resembles that which is being observed to produce constant rates of warming. There’s a good reason for this. Temperature responds logarithmically—i.e.less and less—to changes in this gas as its concentration increases. But the concentration tends to increase exponentially—i.e. more and more. The combination of an increasingly damped response to an ever increasing rate of input tends to resemble a straight line, or a constant rate of warming.
Indeed, Karl noted in his paper (and I have noted in virtually every public lecture I give), that “projections of temperature change in the next [i.e. the 21st] century, using [the United Nations’] business as usual scenarios…have relatively constant rates of global temperature increase”. It’s just that their constant rates tend to be higher than the one that is being observed. The average rate of warming predicted for this century by the UN is about 2.5°C, while the observed value has been, as predicted, constant—but with a lower value of 1.7°. As Figure 3 shows, this rate has been remarkably constant for over three decades.
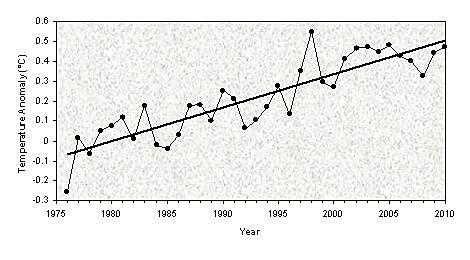
Figure 3. Annual global average surface temperature anomaly (°C), 1976–2010 (data source: Hadley Center). It’s hard to imagine a more constant trend, despite the 1998 peak and the subsequent torpid warming.
The bottom line is that short-term trends are not your friends when talking about long-term climate change.
References
Hansen, J.E., et al., 1988. Global climate changes as forecast by Goddard Institute for Space Studies three-dimensional model. Journal of Geophysical Research, 93, 9341–9364.
Karl, T. R., R. W. Knight, and B. Baker, 2000. The record breaking global temperatures of 1997 and 1998” Evidence for an increase in the rate of global warming? Geophysical Research Letters, 27, 719–722.
Michaels, P. J., and P. C. Knappenberger, 2009. Scientific Shortcomings in the EPA’s Endangerment Finding from Greenhouse Gases, Cato Journal, 29, 497–521, https://www.cato.org/pubs/journal/cj29n3/cj29n3‑8.pdf.
