The Current Wisdom is a series of monthly articles in which Patrick J. Michaels, director of the Center for the Study of Science, reviews interesting items on global warming in the scientific literature that may not have received the media attention that they deserved, or have been misinterpreted in the popular press.
Retired NASA scientist and peripatetic global warming crusader James Hansen has a—let’s put it delicately—unique view of sea-level rise resulting from mankind’s use of fossil fuels. Specifically, he believes global average sea level will rise some 15 to 20 feet by 2095. The central estimate from the most recent report from U.N.’s Intergovernmental Panel on Climate Change (IPCC) is about 15 inches.
Hansen’s an outlier, and proud of it, thinking himself more courageous than other scientists who, he says, are “reticent” to tell the public how bad things really are.
Wethinks that Hansen doth protest too much. His scientific arguments for a large and rapid sea level rise this century simply don’t hold water.
He laid out a summary of his logic on sea level rise in a book chapter (co-authored with Makiko Sato) published last year titled “Paleoclimate Implications for Human-Made Climate Change.”
Below, we have reproduced the relevant text on sea-level rise from that chapter along with our comments highlighting recent findings from the scientific literature which refute each and every one of Hansen’s claims.
From Hansen and Sato (2012):
Sea Level Change Estimates for the 21st Century
IPCC (2007) projected sea level rise by the end of this century of about 29 cm (midrange 20–43 cm, full range 18–59 cm). These projections did not include contributions from ice sheet dynamics, on the grounds that ice sheet physics is not understood well enough.
This is true. Twenty-nine centimeters is the same as 11.4 inches—about 1 foot. And although the IPCC did not specifically include ice sheet dynamics in their models, they did estimate that dynamics may add another 4 inches to their midrange forecast.
Rahmstorf (2007) made an important contribution to the sea level discussion by pointing out that even a linear relation between global temperature and the rate of sea level rise, calibrated with 20th century data, implies a 21st sea level rise of about a meter, given expected global warming for BAU greenhouse gas emissions. Vermeer and Rahmstorf (2009) extended Rahmstorf’s semi-empirical approach by adding a rapid response term, projecting sea level rise by 2100 of 0.75–1.9 m for the full range of IPCC climate scenarios. Grinsted et al. (2010) fit a 4- parameter linear response equation to temperature and sea level data for the past 2000 years, projecting a sea level rise of 0.9–1.3 m by 2100 for a middle IPCC scenario (A1B). These projections are typically a factor of 3–4 larger than the IPCC (2007) estimates, and thus they altered perceptions about the potential magnitude of human-caused sea level change.
True, these projections are 3–4 times larger than the IPCC estimates. They are also founded on weak arguments. As we discussed in a Current Wisdom post back in December, new research by Jonathan Gregory and colleagues concluded that the methodology (a “semi-empirical” approach) used in each of the specific papers cited by Hansen was inadequate to base robust sea level rise projections. According to Gregory, et al., “[The lack of a relationship between global climate change and the rate of global mean sea level rise, GMSLR] also calls into question the basis of the semi-empirical methods for projecting GMSLR, which depend on calibrating a relationship between global climate change or radiative forcing and the rate of GMSLR from observational data (Rahmstorf, 2007; Vermeer and Rahmstorf, 2009; Jevrejeva et al., 2010).” Note that the methodology employed by Jevrejeva et al., (2010) is the same as that used in Grinsted et al (2010) as cited by Hansen. So, to the extent that the studies cited by Hansen “altered perceptions about the potential magnitude of human-caused sea level change” they led to misperceptions.
Alley (2010) reviewed projections of sea level rise by 2100, showing several clustered around 1 m and one outlier at 5 m, all of these approximated as linear in his graph. The 5 m estimate is what Hansen (2007) suggested was possible under IPCC’s BAU climate forcing. Such a graph is comforting – not only does the 5‑meter sea level rise disagree with all other projections, but its half-meter sea level rise this decade is clearly preposterous.
Hansen admits that his 5 meter (16 feet) sea level rise projection by 2100 is a large outlier. We don’t disagree!
However, the fundamental issue is linearity versus non-linearity. Hansen (2005, 2007) argues that amplifying feedbacks make ice sheet disintegration necessarily highly non-linear, and that IPCC’s BAU forcing is so huge that it is difficult to see how ice shelves would survive. As warming increases, the number of ice streams contributing to mass loss will increase, contributing to a nonlinear response that should be approximated better by an exponential than by a linear fit. Hansen (2007) suggested that a 10-year doubling time was plausible, and pointed out that such a doubling time, from a 1 mm per year ice sheet contribution to sea level in the decade 2005–2015, would lead to a cumulative 5 m sea level rise by 2095 [Hansen and Sato Figure 7].
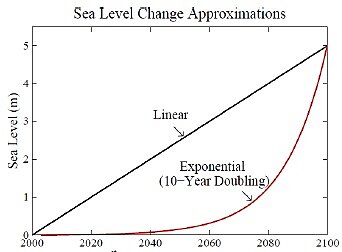
Fig. 7. Five-meter sea level change in 21st century under assumption of linear change and exponential change (Hansen, 2007), the latter with a 10-year doubling time.
The good old “exponential” rise—the alarmist’s dream. Even though you can’t tell I am correct now, just wait! Never mind that most of us will be long dead by then, or that every other observational or theoretical paper disagrees with the magnitude of Hansen’s non-linear rise—as Hansen freely admits:
Nonlinear ice sheet disintegration can be slowed by negative feedbacks. Pfeffer et al. (2008) argue that kinematic constraints make sea level rise of more than 2 m this century physically untenable, and they contend that such a magnitude could occur only if all variables quickly accelerate to extremely high limits. They conclude that more plausible but still accelerated conditions could lead to sea level rise of 80 cm by 2100.
But of course, everyone else is wrong:
The kinematic constraint may have relevance to the Greenland ice sheet, although the assumptions of Pfeffer at al. (2008) are questionable even for Greenland. They assume that ice streams this century will disgorge ice no faster than the fastest rate observed in recent decades. That assumption is dubious, given the huge climate change that will occur under BAU scenarios, which have a positive (warming) climate forcing that is increasing at a rate dwarfing any known natural forcing. BAU scenarios lead to CO2 levels higher than any since 32 My ago, when Antarctica glaciated. By mid-century most of Greenland would be experiencing summer melting in a longer melt season. Also some Greenland ice stream outlets are in valleys with bedrock below sea level. As the terminus of an ice stream retreats inland, glacier sidewalls can collapse, creating a wider pathway for disgorging ice.
In fact, a large body of recent literature into the dynamics of the Greenland ice sheet supports to idea that kinematic constraints act to keep ice loss from Greenland in check, even in a warming climate—contrary to Hansen’s assertions. We have detailed these in past issues of Current Wisdom. For example, we discussed the work of Moon et al. (2012) who concluded: “Finally, our observations have implications for recent work on sea level rise. Earlier research used a kinematic approach to estimate upper bounds of 0.8 to 2.0 m for 21st-century sea level rise. In Greenland, this work assumed ice-sheet-wide doubling of glacier speeds (low-end scenario) or an order of magnitude increase in speeds (high-end scenario) from 2000 to 2010. Our wide sampling of actual 2000 to 2010 changes shows that glacier acceleration across the ice sheet remains far below these estimates, suggesting that sea level rise associated with Greenland glacier dynamics remains well below the low-end scenario (9.3 cm by 2100) at present. Continued acceleration, however, may cause sea level rise to approach the low-end limit by this century’s end.” In other words, kinematic increases in ice loss from Greenland may add 4 inches of sea level rise by 2100—nowhere close to leading to Hansen’s multi-meter rise.
Hansen continues:
The main flaw with the kinematic constraint concept is the geology of Antarctica, where large portions of the ice sheet are buttressed by ice shelves that are unlikely to survive BAU climate scenarios. West Antarctica’s Pine Island Glacier (PIG) illustrates nonlinear processes already coming into play. The floating ice shelf at PIG’s terminus has been thinning in the past two decades as the ocean around Antarctica warms (Shepherd et al., 2004; Jenkins et al., 2010). Thus the grounding line of the glacier has moved inland by 30 km into deeper water, allowing potentially unstable ice sheet retreat. PIG’s rate of mass loss has accelerated almost continuously for the past decade (Wingham et al., 2009) and may account for about half of the mass loss of the West Antarctic ice sheet, which is of the order of 100 km3 per year (Sasgen et al., 2010).
While West Antarctica may be losing ice mass, East Antarctica appears to be gaining, as higher sea surface temperatures lead to more moisture in the atmosphere which leads to greater snowfall there. Since the temperatures are far below freezing throughout the year, the increased snowfall accumulates over time, adding ice mass across vast areas of East Antarctica. This effect has long been anticipated, and observations over the past few years are now starting to verify this forecast. (e.g., Boening et al., 2012; Lenaerts, et al., 2013). The latest estimates of the net ice loss from the whole of Antarctica find either minimal loss (a sea level rise equivalent of 0.71 inches/century) with no acceleration (King et al., 2012) or that the continent is actually gaining ice mass (Zwally et al., 2012). Either finding is completely at odds with Hansen’s accelerating ice loss scenario.
PIG and neighboring glaciers in the Amundsen Sea sector of West Antarctica, which are also accelerating, contain enough ice to contribute 1–2 m to sea level. Most of the West Antarctic ice sheet, with at least 5 m of sea level, and about a third of the East Antarctic ice sheet, with another 15–20 m of sea level, are grounded below sea level. This more vulnerable ice may have been the source of the 25 ± 10 m sea level rise of the Pliocene (Dowsett et al., 1990, 1994). If human-made global warming reaches Pliocene levels this century, as expected under BAU scenarios, these greater volumes of ice will surely begin to contribute to sea level change. Indeed, satellite gravity and radar interferometry data reveal that the Totten Glacier of East Antarctica, which fronts a large ice mass grounded below sea level, is already beginning to lose mass (Rignot et al., 2008).
Oops. Wrong again. Breaking scientific research just published online from the journal Science (Rowley et al., 2013) conclude that the apparent 25 ± 10 meter sea level rise during the Pliocene was probably due to vertical land motions during the intervening 3 million years rather than an actual sea level rise from more water in the oceans from melting ice (Hansen’s mechanism). Rowley and colleagues developed a model of the dynamics of the earth’s mantle and glacial rebound that can explain why ancient (Pliocene) seashore deposits are located about 25 meters above the current sea level across the southeastern United States. Previously, as in the research relied upon by Hansen, these elevated shoreline deposits has been used as primary evidence arguing for much higher sea levels during the warmer Pliocene era. Again, contrary to Hansen’s assertions, Rowley et al. state that “[i]nferences of Pliocene global sea-level heights or stability of Antarctic ice sheets therefore cannot be deciphered in the absence of an appropriate mantle dynamic reference frame.” Hansen has made no such considerations.
Hansen concludes:
The eventual sea level rise due to expected global warming under BAU GHG scenarios is several tens of meters, as discussed at the beginning of this section. From the present discussion it seems that there is sufficient readily available ice to cause multi-meter sea level rise this century, if dynamic discharge of ice increases exponentially. Thus current observations of ice sheet mass loss are of special interest.
Unfortunately for Hansen and fortunately for the rest of us, virtually all the science comprising his “present discussion” has been undermined by more recent findings. The foundation of his “multi-meter sea level rise this century” which was never robust to begin with, has now collapsed completely.
We do agree, however, with his final sentence that “current observations of ice sheet mass loss are of special interest.” This is a topic that we very often discuss in our Current Wisdoms and will most certainly do so in the future. The gist of the recent observations is that the rate of sea level rise is quite modest (about a foot per century) and any speed-up is also expected to be quite modest—a combination which proves Hansen’s projections are alarmist.
And we are not reticent about it.
References:
Boening, C. et al., 2012. Snowfall-driven mass change on the East Antarctic ice sheet. Geophysical Research Letters, 39, DOI:10.1029/2012GL053316.
Hansen, J.E., and M. Sato, 2012. Paleoclimate implications for human-made climate change. In Climate Change: Inferences from Paleoclimate and Regional Aspects. A. Berger, F. Mesinger, and D. Šijački, Eds. Springer, 21–48, doi:10.1007/978–3‑7091–0973-1_2.
Lenaerts, J.T.M., et al., 2013. Recent snowfall anomalies in Dronning Maud Land, east Antarctica, in a historical and future climate perspective. Geophysical Research Letters, doi:10.1002/grl.50559.
King, M., et al., 2012. Lower satellite-gravimetry estimates of Antarctic sea-level contribution. Nature, doi:10.1038/nature
Moon, T., I. Joughin, B. Smith, and I. Howat, 2012. 21st-century evolution of Greenland outlet glacier velocities. Science, 336, 576–578, doi:10.1126/science.1219985
Rowley, D.B., et al., 2013. Dynamic topography change of the Eastern United States since 3 million years ago. Sciencexpress, doi:10.1126/science.1229180
Zwally, H.J., et al., 2012. Mass gains of the Antarctic ice sheet exceed losses. Presentation to the SCAR ISMAA Workshop, July 14, 2012, Portland Oregon.
