The Current Wisdom is a series of monthly posts in which Senior Fellow Patrick J. Michaels reviews interesting items on global warming in the scientific literature that may not have received the media attention that they deserved, or have been misinterpreted in the popular press.
The Current Wisdom only comments on science appearing in the refereed, peer‐reviewed literature, or that has been peer‐screened prior to presentation at a scientific congress.
Better Model, Less Warming
Bet you haven’t seen this one on TV: A newer, more sophisticated climate model has lost more than 25% of its predicted warming! You can bet that if it had predicted that much more warming it would have made the local paper.
The change resulted from a more realistic simulation of the way clouds work, resulting in a major reduction in the model’s “climate sensitivity,” which is the amount of warming predicted for a doubling of the concentration of atmospheric carbon dioxide over what it was prior to the industrial revolution.
Prior to the modern era, atmospheric carbon dioxide concentrations, as measured in air trapped in ice in the high latitudes (which can be dated year‐by‐year) was pretty constant, around 280 parts per million (ppm). No wonder CO2 is called a “trace gas”—there really is not much of it around.
The current concentration is pushing about 390 ppm, an increase of about 40% in 250 years. This is a pretty good indicator of the amount of “forcing” or warming pressure that we are exerting on the atmosphere. Yes, there are other global warming gases going up, like the chlorofluorocarbons (refrigerants now banned by treaty), but the modern climate religion is that these are pretty much being cancelled by reflective “aerosol” compounds that go in the air along with the combustion of fossil fuels, mainly coal.
Most projections have carbon dioxide doubling to a nominal 600 ppm somewhere in the second half of this century, absent no major technological changes (which history tells us is a very shaky assumption). But the “sensitivity” is not reached as soon as we hit the doubling, thanks to the fact that it takes a lot of time to warm the ocean (like it takes a lot of time to warm up a big pot of water with a small burner).
So the “sensitivity” is much closer to the temperature rise that a model projects about 100 years from now – assuming (again, shakily) that we ultimately switch to power sources that don’t release dreaded CO2 into the atmosphere somewhere around the time its concentration doubles.
The bottom line is that lower sensitivity means less future warming as a result of anthropogenic greenhouse gas emissions. So our advice… keep on working on the models, eventually, they may actually arrive at something close puny rate of warming that is being observed
At any rate, improvements to the Japanese‐developed Model for Interdisciplinary Research on Climate (MIROC) are the topic of a new paper by Masahiro Watanabe and colleagues in the current issue of the Journal of Climate. This modeling group has been working on a new version of their model (MIROC5) to be used in the upcoming 5th Assessment Report of the United Nations’ Intergovernmental Panel on Climate Change, due in late 2013. Two incarnations of the previous version (MIROC3.2) were included in the IPCC’s 4th Assessment Report (2007) and contribute to the IPCC “consensus” of global warming projections.
The high resolution version (MIROC3.2(hires)) was quite a doozy – responsible for far and away the greatest projected global temperature rise (see Figure 1). And the medium resolution model (MIROC3.2(medres)) is among the Top 5 warmest models. Together, the two MIROC models undoubtedly act to increase the overall model ensemble mean warming projection and expand the top end of the “likely” range of temperature rise.
FIGURE 1
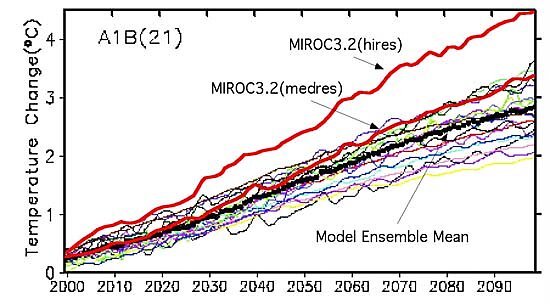
Global temperature projections under the “midrange” scenario for greenhouse‐gas emissions produced by the IPCC’s collection of climate models. The MIROC high resolution model (MIROC3.2(hires)) is clearly the hottest one, and the medium range one isn’t very far behind.
The reason that the MIROC3.2 versions produce so much warming is that their sensitivity is very high, with the high‐resolution at 4.3°C (7.7°F) and the medium‐resolution at 4.0°C (7.2°F). These sensitivities are very near the high end of the distribution of climate sensitivities from the IPCC’s collection of models (see Figure 2).
FIGURE 2
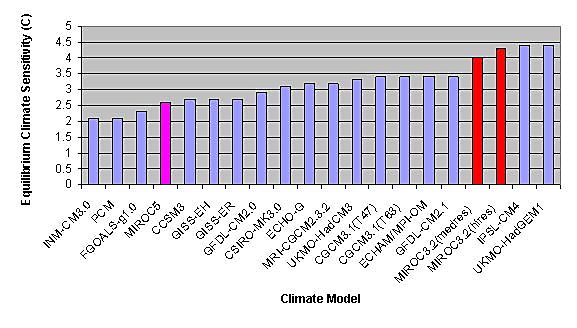
Equilibrium climate sensitivities of the models used in the IPCC AR4 (with the exception of the MIROC5). The MIROC3.2 sensitivities are highlighted in red and lie near the upper und of the collection of model sensitivities. The new, improved, MIROC5, which was not included in the IPCC AR4, is highlighted in magenta, and lies near the low end of the model climate sensitivities (data from IPCC Fourth Assessment Report, Table 8.2 and Watanabe et al., 2010).
Note that the highest sensitivity is not necessarily in the hottest model, as observed warming is dependent upon how the model deals with the slowness of the oceans to warm.
The situation is vastly different in the new MIROC5 model. Watanabe et al. report that the climate sensitivity is now 2.6°C (4.7°F) – more than 25% less than in the previous version on the model.[1] If the MIROC5 had been included in the IPCC’s AR4 collection of models, its climate sensitivity of 2.6°C would have been found near the low end of the distribution (see Figure 2), rather than pushing the high extreme as MIROC3.2 did.
And to what do we owe this large decline in the modeled climate sensitivity? According to Watanabe et al., a vastly improved handling of cloud processes involving “a prognostic treatment for the cloud water and ice mixing ratio, as well as the cloud fraction, considering both warm and cold rain processes.” In fact, the improved cloud scheme—which produces clouds which compare more favorably with satellite observations—projects that under a warming climate low altitude clouds become a negative feedback rather than acting as positive feedback as the old version of the model projected.[2] Instead of enhancing the CO2‐induced warming, low clouds are now projected to retard it.
Here is how Watanabe et al. describe their results:
A new version of the global climate model MIROC was developed for better simulation of the mean climate, variability, and climate change due to anthropogenic radiative forcing….
MIROC5 reveals an equilibrium climate sensitivity of 2.6K, which is 1K lower than that in MIROC3.2(medres).… This is probably because in the two versions, the response of low clouds to an increasing concentration of CO2 is opposite; that is, low clouds decrease (increase) at low latitudes in MIROC3.2(medres) (MIROC5).[3]
Is the new MIROC model perfect? Certainly not. But is it better than the old one? It seems quite likely. And the net result of the model improvements is that the climate sensitivity and therefore the warming projections (and resultant impacts) have been significantly lowered. And much of this lowering comes as the handling of cloud processes—still among the most uncertain of climate processes—is improved upon. No doubt such improvements will continue into the future as both our scientific understanding and our computational abilities increase.
Will this lead to an even greater reduction in climate sensitivity and projected temperature rise? There are many folks out there (including this author) that believe this is a very distinct possibility, given that observed warming in recent decades is clearly beneath the average predicted by climate models. Stay tuned!
References:
Intergovernmental Panel on Climate Change, 2007. Fourth Assessment Report, Working Group 1 report, available at http://www.ipcc.ch.
Watanabe, M., et al., 2010. Improved climate simulation by MIROC5: Mean states, variability, and climate sensitivity. Journal of Climate, 23, 6312–6335.
[1] Watanabe et al. report that the sensitivity of MIROC3.2 (medres) is 3.6°C (6.5°), which is less that what was reported in the 2007 IPCC report. So 25% is likely a conservative estimate of the reduction in warming.
[2] Whether enhanced cloudiness enhances or cancels carbon‐dioxide warming is one of the core issues in the climate debate, and is clearly not “settled” science.
[3] Degrees Kelvin (K) are the same as degrees Celsius (C) when looking at relative, rather than absolute temperatures.
