The Consumer Price Index was up only 0.33% in April, or a compound annual rate of 4.1% – the slowest since last August. Yet CNBC, like others, reported that “The consumer price index accelerated 8.3% in April.” No, it accelerated at half that rate.
The nearly universal error is to describe the monthly change the way illustrated by the black line, as the year-to-year percentage change between April 2021 and April 2022. Although that number is routinely reported as “the” inflation rate for April 2022 it is a backward-looking average of increases over the past twelve months, with the largest increases happening about a year ago.
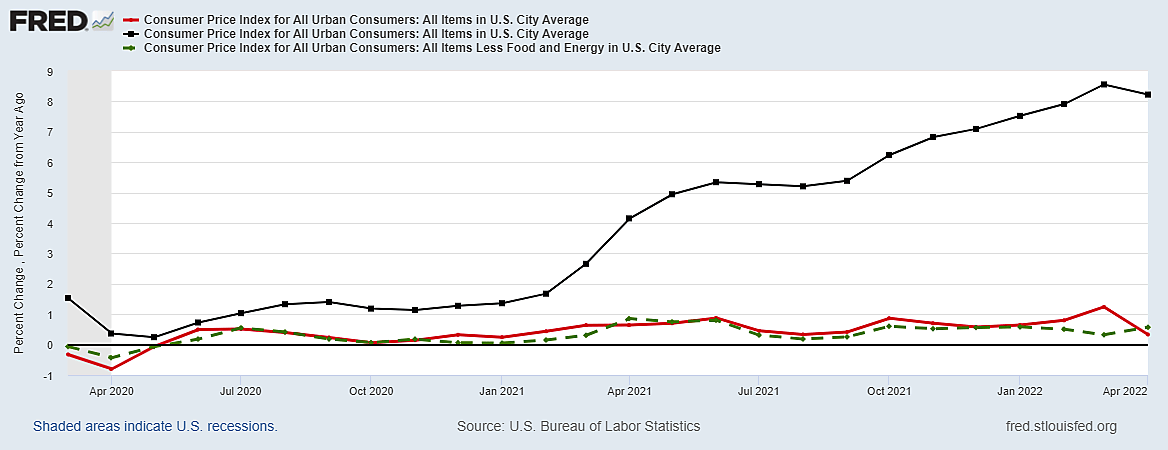
Popular though it is, the year-to-year change is a history of the past 12 months, relative the previous 12 months (the pandemic trough of 2020). That is a lagging indicator of what happened in 2021 rather than a coincident indicator of what has been happening in 2022.
The red line, by contrast, is timely. It shows monthly changes in the “headline” CPI compared to the month before rather than the year before. Shelter, food, airline fare and new vehicles were the largest price increases, while prices of apparel, communication and used cars all fell.
The green line shows monthly changes in the “core” CPI, excluding food (which account for 13.4% of the CPI) and direct energy prices (which account for 8.3%). Food prices rose 0.9% in April, but energy prices supposedly fell 2.7%. That is because gasoline prices fell 6.1% on a month-to-month average even though they ended the month higher than they began. Were it not for that statistical oddity, excluding the substantial increase in food prices would have resulted in a lower core CPI.
The latest 12-month average starts with April 2021 when the monthly CPI suddenly surged by 0.64% – twice as fast as the 0.33% rise this April. But because many prices fell in April 2020 (the start of the pandemic) the year-to-year change in April 2021 was just 4.2%. In May 2021, the CPI rose even faster, by 0.75% pushing the year-to-year rise to 4.9%. In June 2021, the monthly CPI rose faster still, by 0.87%, but that was reported as only 5.5% on the misleading year-to-year basis.
In short, the CPI suddenly increased at a frantic 8.2% annual rate from April to June of 2021 and those increases remain embedded in the year-to-year rise journalists allude to as being near a 40-year high. Yet much or most of that high inflation peaked about a year ago. More journalists and economists should study when it happened because that knowledge helps explain why it happened.
The economic reopening in most states and nations by March 2021 was part of the explanation because citizens of most states were suddenly free to travel, shop, eat in restaurants and get their hair cut. Yet the reason inflation surged more in the U.S. than in most other countries last Spring, was a uniquely American fiscal splurge.
In March of 2021, a uniquely massive and late U.S. “fiscal stimulus” was handing out big checks, most famously a third round of the largest stimulus checks of the COVID-19 crisis. “On Thursday 11 March, Biden signed his $1.9tn American Rescue Plan into law. The third payment provided eligible individual taxpayers for a check of up to $1,400″ per family member ($4,200 for a family of four).
As the economy reopened, consumers had their pockets stuffed with another round of handouts on top of previous ones (which had been largely saved because mandates left us with so little to buy). Little wonder that in April 2021 there was a rush to buy goods and services faster than supply could catch up, with many supply chains broken by a year of global lockdowns. It was not possible in the Spring of 2021 to quickly reopen closed factories, stores, or oil wells. And it is not possible even now to quickly grow wheat, feed grains, soybeans, cattle, dairy cows, hogs, or chicken.
When defining inflation over 12-month spans, logic and evidence suggest it is fair and accurate (not just partisan) to blame a few percentage points of the high year-to-year inflation numbers on the overblown March 2021 pandemic payouts. And that is because the past twelve months still includes the unusually rapid burst of inflation from April to June last year. But the payouts stopped last year, so they explain little of what happened so far this year.
For the future, we need to emphasize current data – viewing each new month one at a time while understanding that the Russia-Ukraine war is indeed boosting world commodity prices, particularly energy and food. The Fed and other central banks cannot possibly do anything to quickly reduce year-to-year CPI headline inflation because most months included in that statistic are now behind us. As for this year’s supply shocks to global food and energy prices, that could best be fixed by world peace.
